In the present webpage, galactic cosmic rays (GCRs) fluences computed/predicted within SR-NIEL/HelMod frameworks are compared with those from SPENVIS and CREME websites. In addition - as a case study -, the expected number of single event effects (SEEs) is computed - as a function of solar modulation model - for a Rad-hard 14-bit 400MSPS D/A converter (i.e., the part type DAC5675A discussed in [HIREX (2010)]) using the SEE cross section provided in [HIREX (2010)].
For the current case study, Fe-ions spectral fluences in units of [cm2 MeV/amu] were obtained, at 1 AU, for Carrington rotations (CR) 2148 (March 11, 2014 - April 7, 2014) and 2190 (April 29, 2017 - May 26, 2017) with solar conditions close to those of AMS-02 proton observations regarding the Bartels rotations 2464 (March 6, 2014 - April 1, 2014) and 2506 (April 13, 2017 - May 9, 2017) and discussed in this webpage. The CR duration is 2 356 992 s.
The solar modulation models employed are:
- CREME version 96 [CREME (1996)] and version 2009 (e.g., see [CREME (2012)]) using the CREME FLUX module as available from CREME website upon registration;
- ISO-15390 model (e.g., see [ANSI (2004)]) using the package for galactic cosmic ray models as available from SPENVIS website upon registration;
- ISO(-15390)-DLR model (e.g., see [Matthiä et al (2013)]) using the web calculator as available from helmod.org website;
- HelMod (2019a) model using the web calculator as available from helmod.org website (e.g., see [HelMod (2019b)]).
HelMod is a well-known Monte Carlo code developed to describe the transport of GCRs through the heliosphere from the interstellar space down to the Earth. Furthermore, the join GalProp-HelMod (2016) effort allowed one to determine local interstellar spectra (LIS) of protons, antiprotons, ions and electrons (e.g., [HelMod (2019a)]).
In the current HelMod version 4 the modulation process, based on Parker’s equation, is applied to the propagation of GCRs in the inner and outer heliosphere, i.e., including the heliosheath. It has to be remarked that the HelMod model was capable to reproduce protons, antiprotons, nuclei and electrons cosmic rays spectra observed during solar cycles 23–24 by several detectors, for instance, PAMELA, BESS and AMS-02 (e.g., see [HelMod (2019a)]). In particular, the unprecedented accuracy of AMS-02 observations allowed one a better tuning of the description regarding the solar modulation mechanisms implemented in HelMod. In addition, HelMod demonstrated to be capable of reproducing the fluxes observed by the Voyager probes in the inner and outer regions of heliosphere up to its border.
In the following treatment, the unrestricted linear energy transfer - i.e., the electronic stopping power (as discussed in this webpage, see also [ICRU-85 (2011)]) - is indicated with the term "LET" in units of [MeV cm2 g-1] (e.g., see Section 2 of [ESCC-25100 (2014)]) whose values for the traversed medium are, for instance, those from SRIM. In the current study, the medium considered is silicon and the electronic stopping power values are both those employed in SPENVIS and the ones obtained from the SRIM-based electronic stopping power calculator at the SR-NIEL website (indicated as from SR-NIEL framework).
The present webpage is organized as follows:
- Solar activity during solar cycles 23 and 24
- Fe-ion spectral fluences from solar modulation models
- LET fluences from SPENVIS website and SR-NIEL framework for ISO-15390 model
- Estimated number of SEE as a function of modulation model
Solar activity during solar cycles 23 and 24
In Figure 1, it is shown a) the time evolution (green curve) of smoothed monthly total sun spot numbers (SSN) during the latest two solar cycles 23 and 24 with corresponding daily total SSNs (light gray curve) and b) the occurrence of the two Carrington rotations (CR) 2148 (March 11, 2014 - April 7, 2014) and 2190 (April 29, 2017 - May 26, 2017), the former during a period of high solar activity, the latter during the descending phase towards the minimum of solar activity.
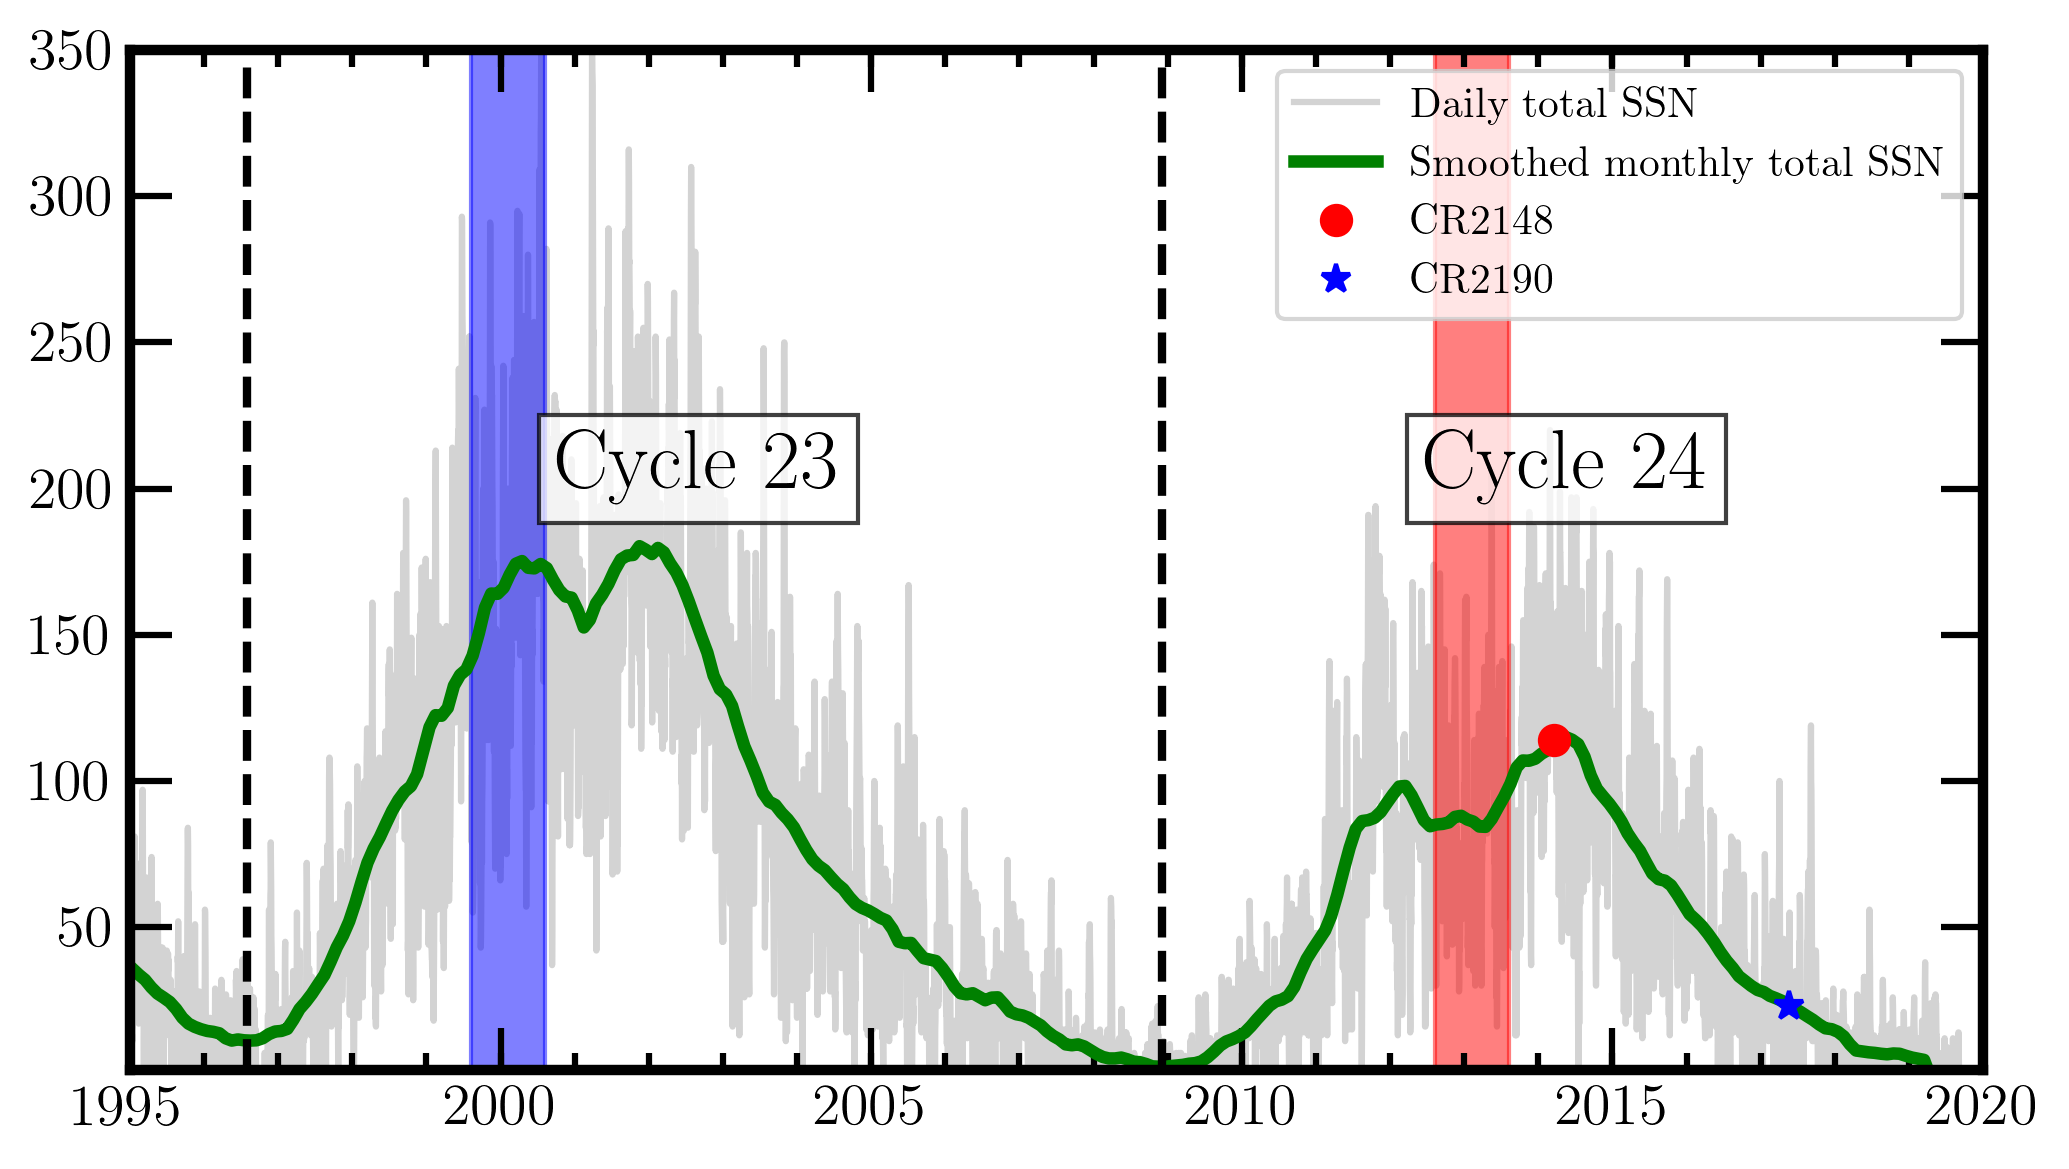
Figure 1. Time evolution of smoothed monthly total sun spot numbers SSN (green line) during the latest two solar cycles 23 and 24 with corresponding daily total SSNs (light gray line) from WDC-SILSO, Royal Observatory of Belgium, Brussels. Vertical black dashed lines indicate the start date of the new cycle. Vertical blue (red) band denotes a period of the solar magnetic field reversal towards a negative (positive) polarity. A red full circle (blue full star) indicates the time occurrence of CR2148 (CR2190).
Fe-ion spectral fluences from modulation models
In the upper panel of Figure 2 (3), the Fe-ion spectral fluences for CR2148 (CR2190) - obtained at 1AU from the above mentioned solar modulation models - are reported in units of [cm2 MeV/amu]-1 as a function of energy in MeV/amu. The spectral fluences are plotted from 44.5 MeV/amu, i.e., from about 2 MeV/amu above the kinetic energy threshold for allowing an Fe-ion to emerge when the incoming particle strikes perpendicularly an Al absorber with a thickness of 50 mils (see the discussion in this webpage). The maximum energy available for CREME96, CREME2009 and ISO-15390 models is 105 MeV/amu, while it is 1.4x10⁶ MeV/amu for HelMod and ISO-DLR models. However, in the current case study, all modulation models were investigated up to 105 MeV/amu. Relative differences of the solar model spectral fluence φ(E) with respect to that of HelMod model (φHelMod(E)) are calculated as

they are shown in the lower panels of Figures 2 and 3.
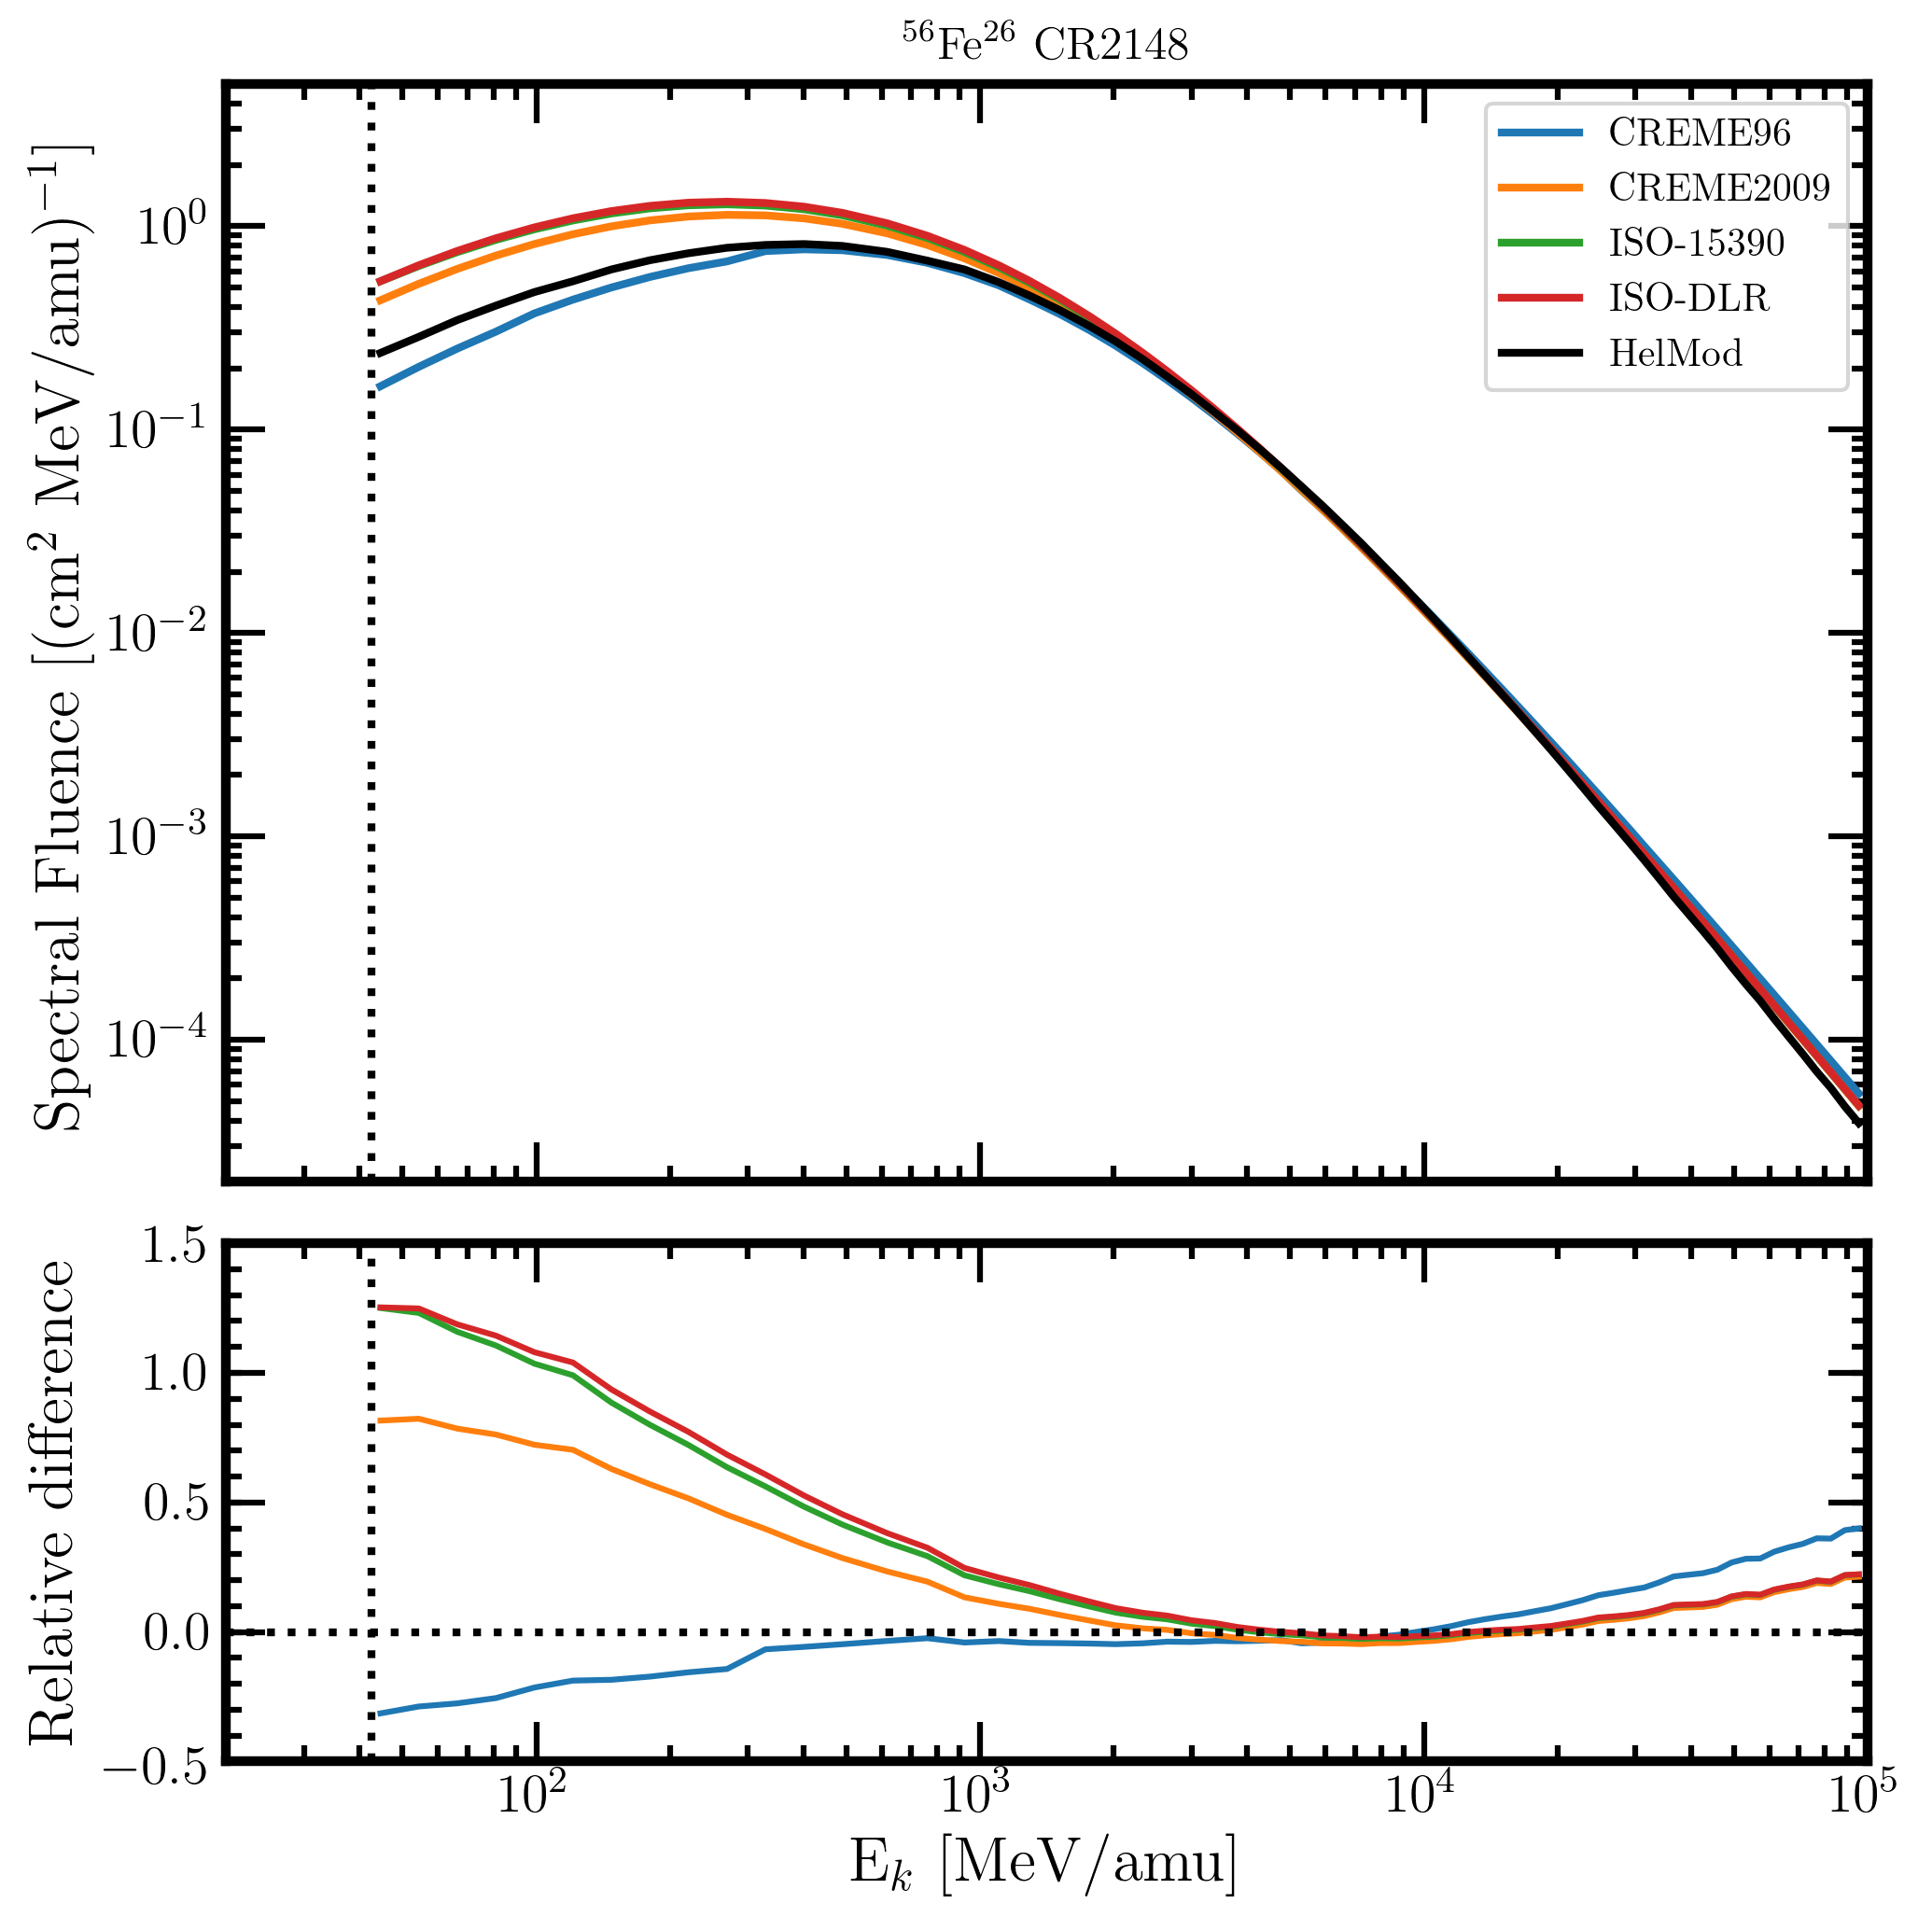
Figure 2. Upper panel: Fe-ion spectral fluences at 1AU as a function of the ion energy in MeV/amu from 44.5 MeV/amu up to 105 MeV/amu for CR2148 (upper panel) in units of [cm2 MeV/amu]-1 for the presently investigated modulation models: CREME96 (blue curve), CREME2009 (orange curve), ISO-15390 (green curve), ISO-DLR (red curve) and HelMod (black curve). Lower panel: relative differences with respect to HelMod model calculated using Eq. (1). The dotted vertical line represents 44.5 MeV/amu.
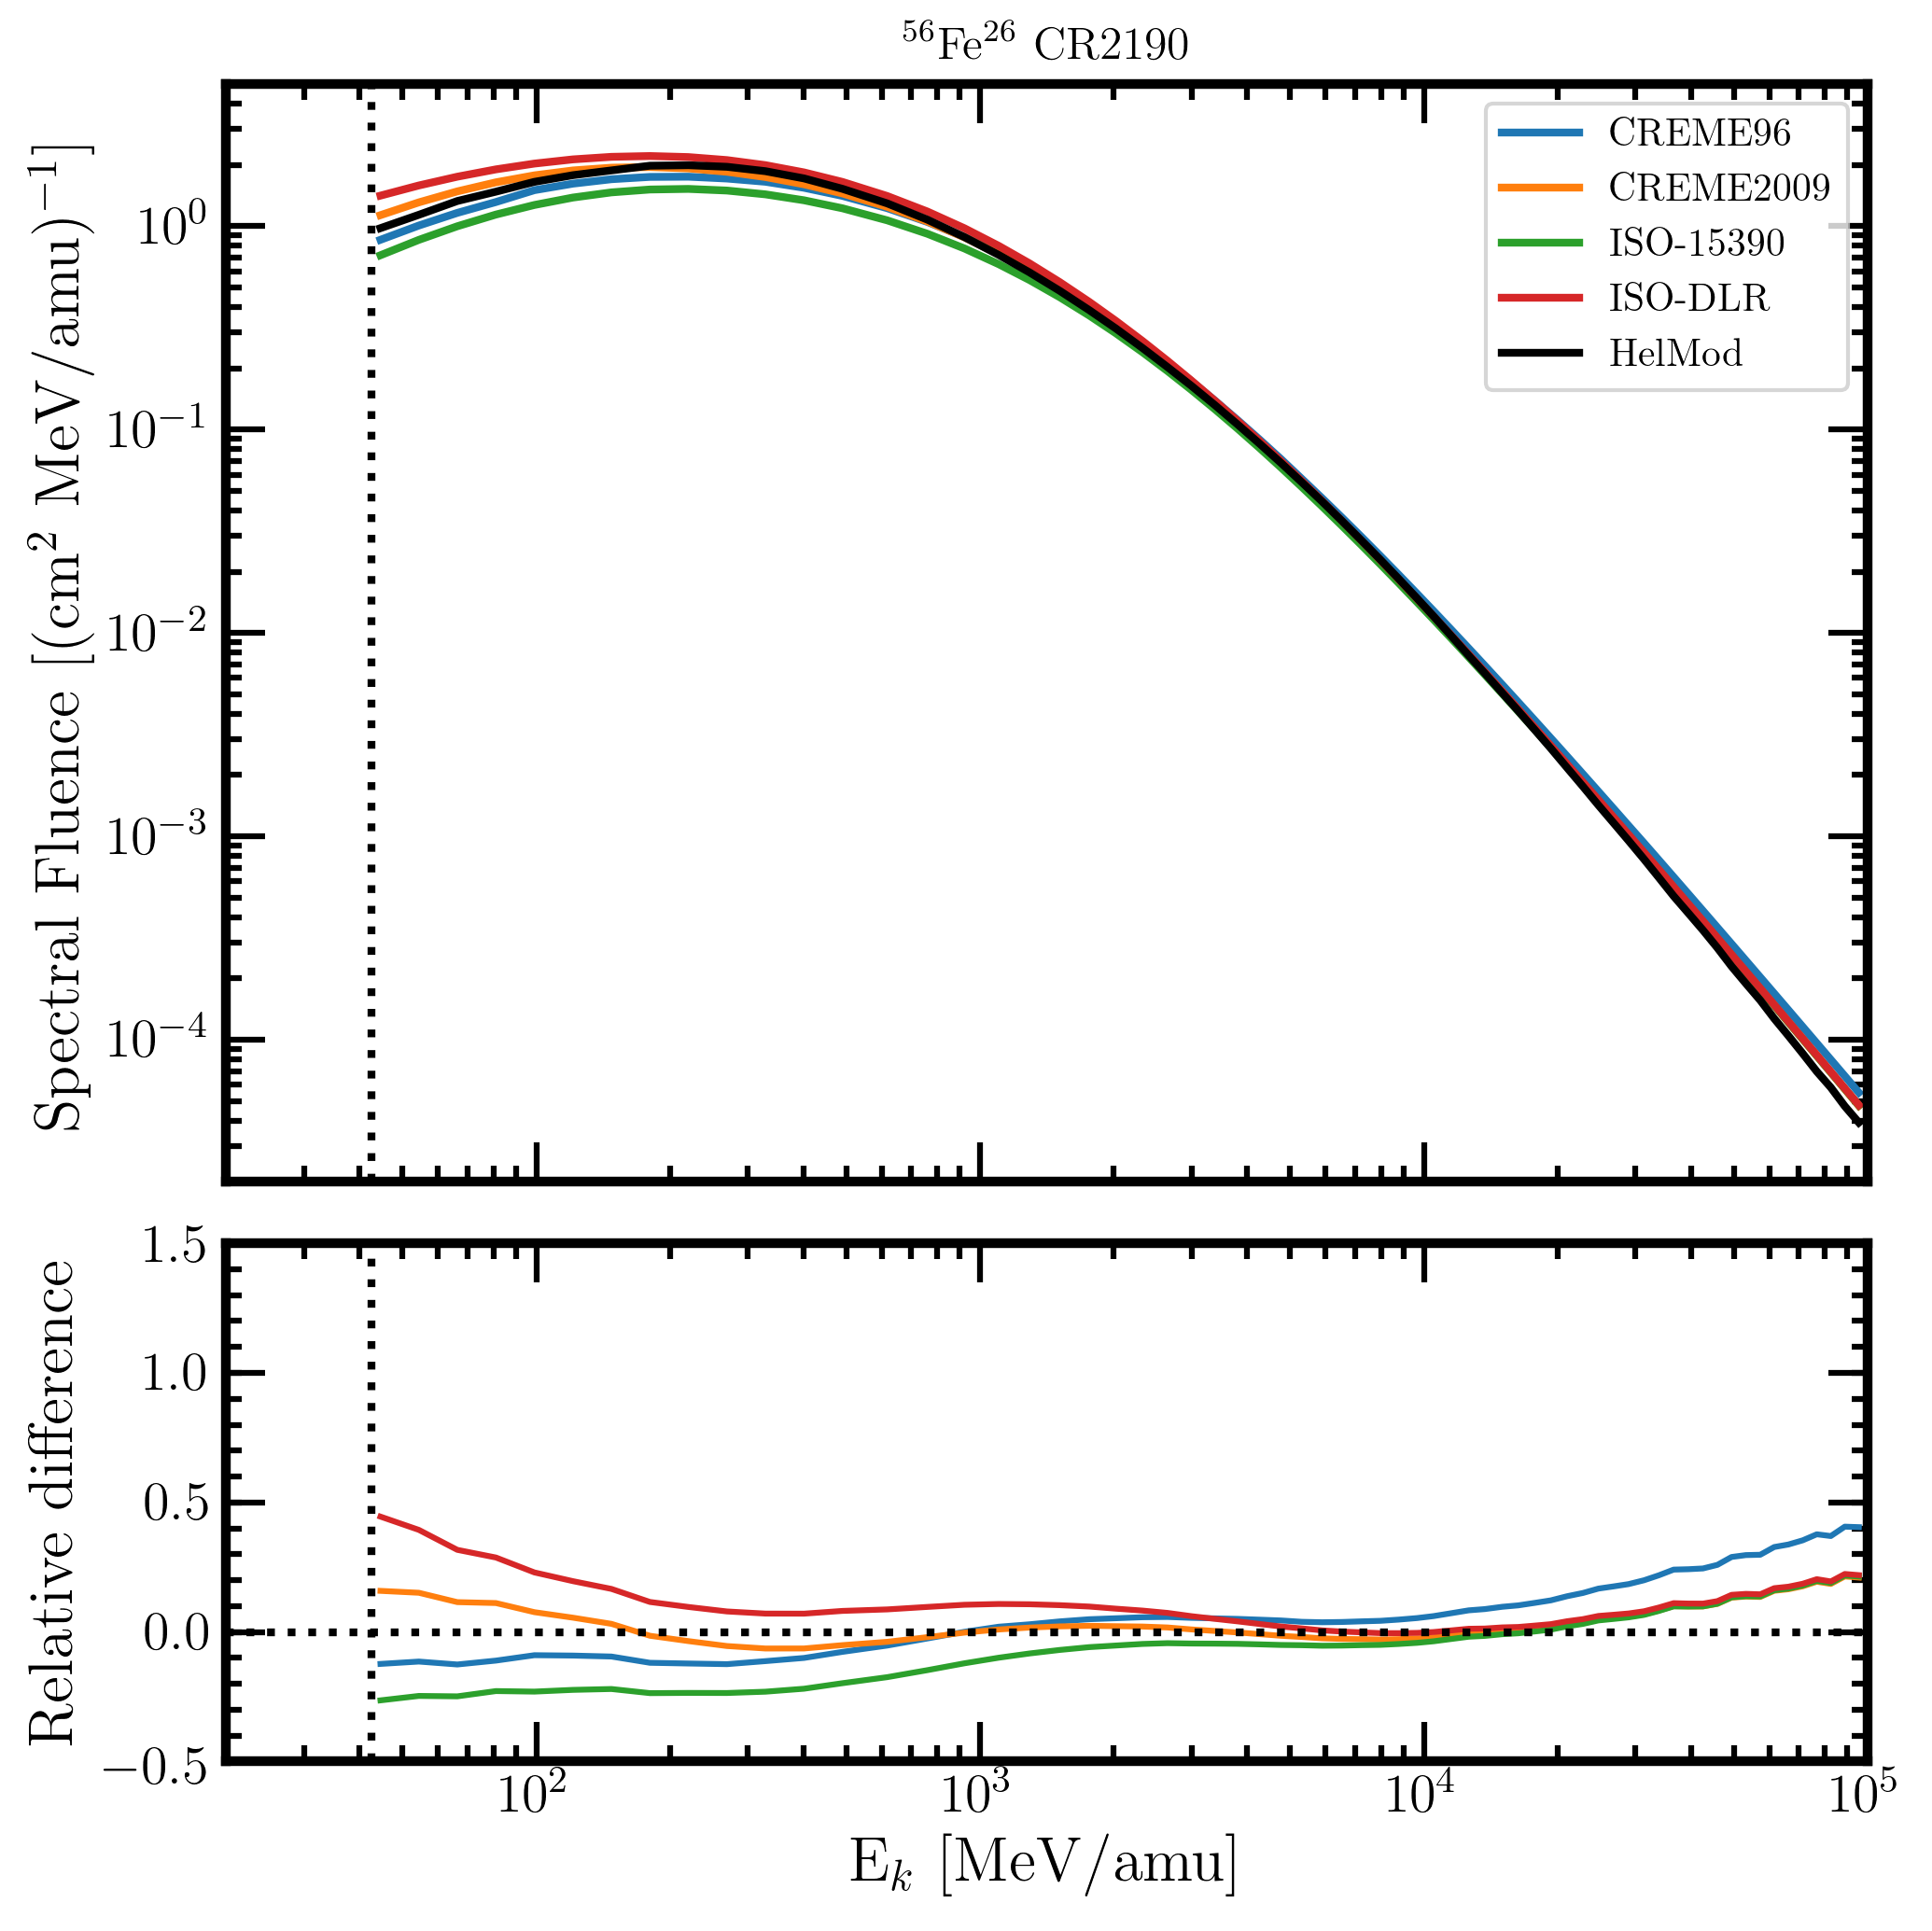
Figure 3.Upper panel: Fe-ion spectral fluences at 1AU as a function of the ion energy in MeV/amu from 44.5 MeV/amu up to 105 MeV/amu for CR2190 (upper panel) in units of [cm2 MeV/amu]-1 for the presently investigated modulation models: CREME96 (blue curve), CREME2009 (orange curve), ISO-15390 (green curve), ISO-DLR (red curve) and HelMod (black curve). Lower panel: relative differences with respect to HelMod model calculated using Eq. (1). The dotted vertical line represents 44.5 MeV/amu.
By inspection Figures 2 and 3, one can note that large variations - up to about (45-125)% - with respect to HelMod spectral fluence are exhibited by ISO-15390/ISO-DLR models, in particular at low energies. Furthermore, in Figure 4, the fluence ratios between CR2190 and CR2148 as a function of the ion energy in MeV/amu are shown for the presently investigated solar modulation models.
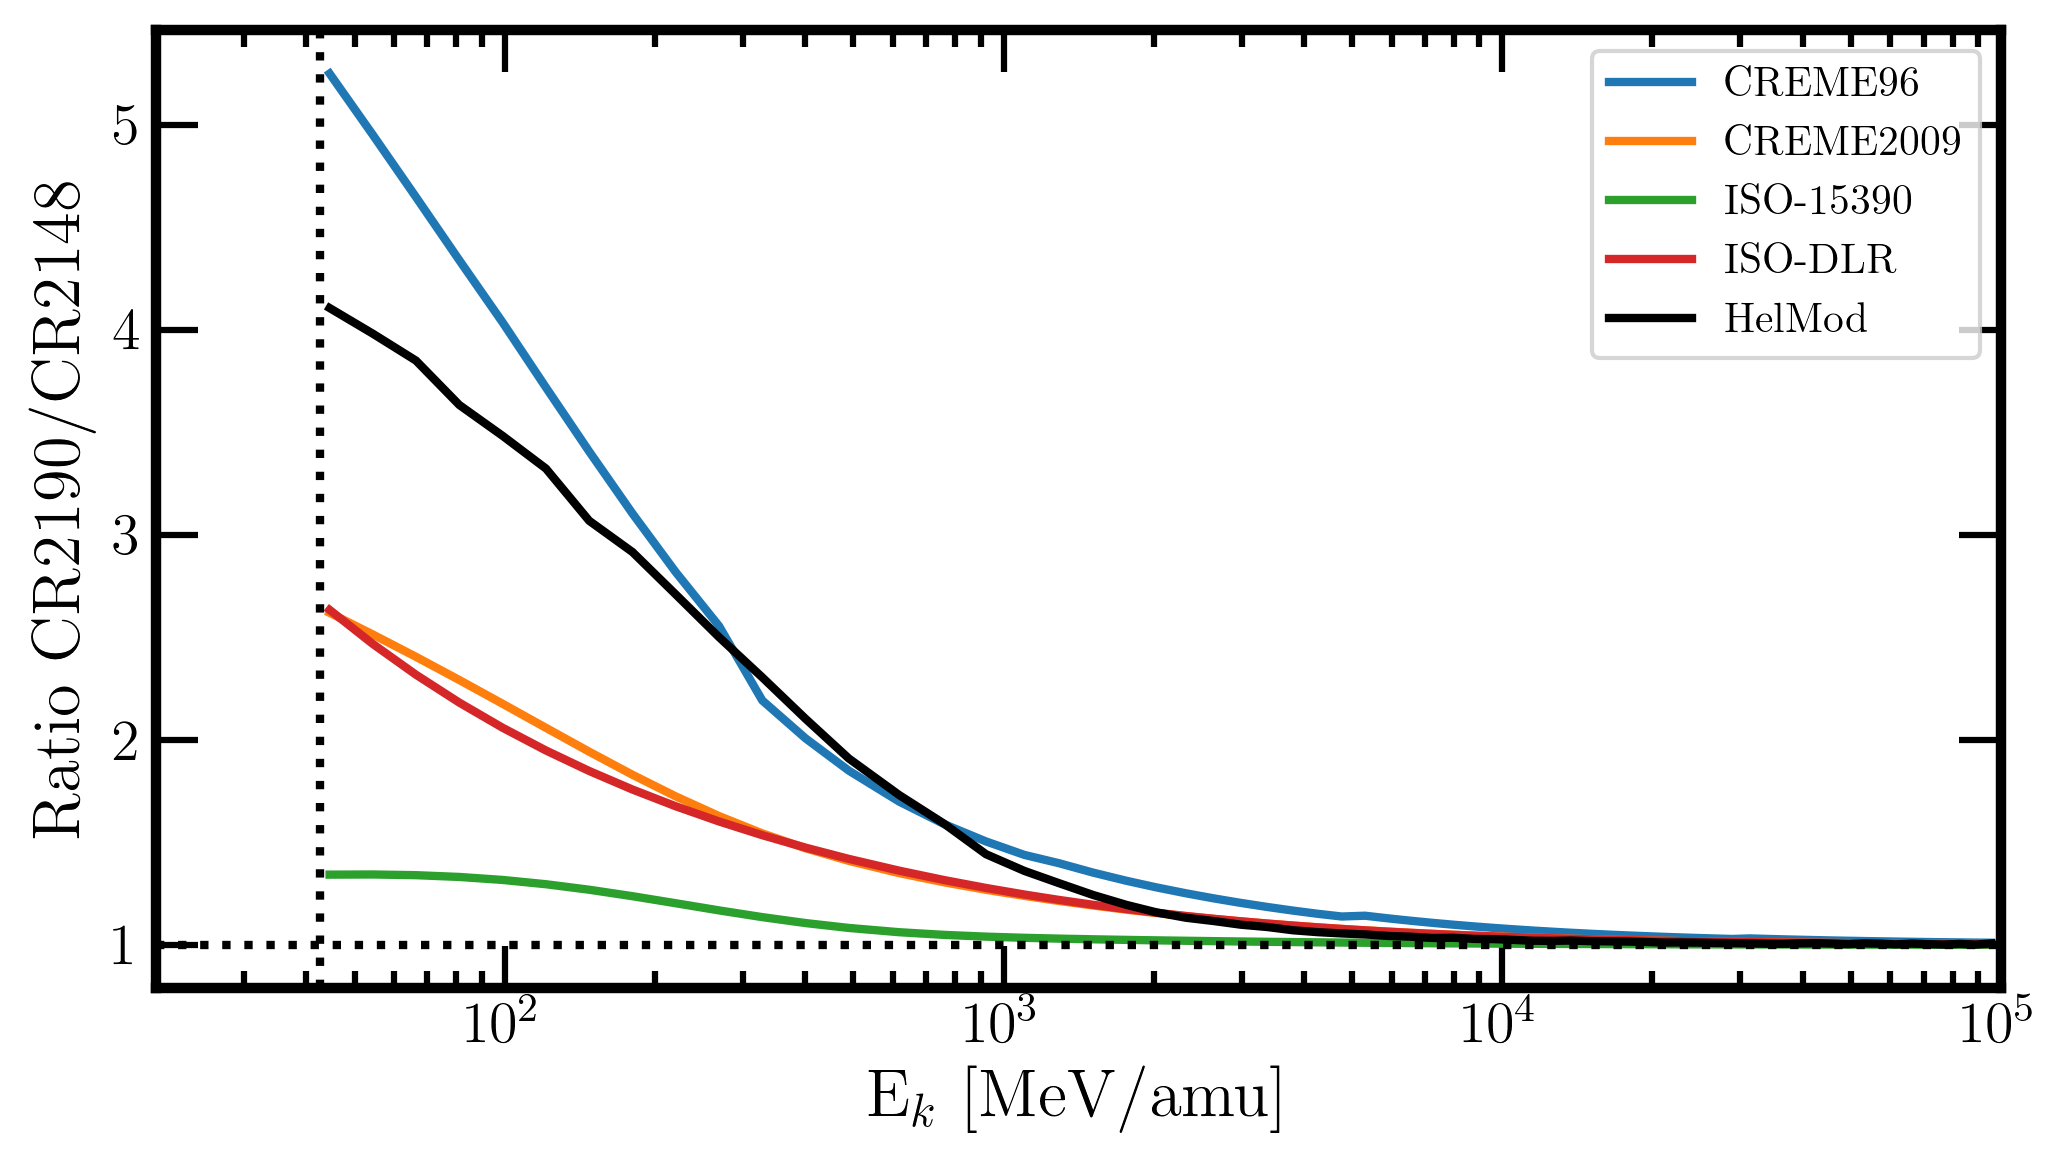
Figure 4. Fluence ratios between CR2190 and CR2148 from 44.5 MeV/amu up to 105 MeV/amu for the presently investigated solar modulation models as a function of ion energy in MeV/amu. The dotted vertical line represents 44.5 MeV/amu.
In Table 1, the total fluence from 44.5 up to 105 MeV/amu is reported for the currently considered modulation models. The obtained ion-fluences vary from -13.2% up to 25.0% with respect to that of HelMod model. In Table 2, the total fluence from 44.5 up to 104 MeV/amu - i.e., the upper energy limit at which the electronic stopping power for Fe-ions in silicon is available from SRIM - is reported as a function of modulation model. The obtained ion-fluences vary from -13.9% up to 25.6% with respect to that of HelMod model.
| Solar Modulation model |
CR2148 | CR2190 | Fluence ratio | ||
|
Fluence |
Difference with respect |
Fluence |
Difference with respect to HelMod [%] |
||
| CREME96 | 1.61 | -4.6 | 2.50 | -1.9 | 1.55 |
| CREME2009 | 1.93 | 14.0 | 2.53 | -0.8 | 1.31 |
| ISO-15390 | 2.07 | 22.4 | 2.21 | -13.2 | 1.07 |
| ISO-DLR | 2.11 | 25.0 | 2.78 | 9.1 | 1.32 |
| HelMod | 1.69 | - | 2.55 | - | 1.51 |
Table 1. Total fluence from 44.5 up to 105 MeV/amu for the five investigated models, the two CRs considered and their percentage difference with respect to HelMod model are shown. The last column reports the ratio of CR2190 fluence over that for CR2148.
| Solar Modulation model |
CR2148 | CR2190 | Fluence ratio | ||
| Fluence [103 cm-2] |
Difference with respect |
Fluence [103 cm-2] |
Difference with respect to HelMod [%] |
||
| CREME96 | 1.51 | -5.6 | 2.39 | -2.4 | 1.58 |
| CREME2009 | 1.83 | 14.2 | 2.43 | -0.8 | 1.33 |
| ISO-15390 | 1.97 | 23.1 | 2.11 | -13.9 | 1.07 |
| ISO-DLR | 2.01 | 25.6 | 2.67 | 9.0 | 1.33 |
| HelMod | 1.60 | - | 2.45 | - | 1.53 |
Table 2. Total fluence from 44.5 up to 104 MeV/amu - i.e., the upper energy limit at which the electronic stopping power for Fe-ion in silicon is available from SRIM - for the five investigated models, the two CRs considered and their percentage difference with respect to HelMod model are shown. The last column reports the ratio of CR2190 fluence over that for CR2148.
LET fluences from SPENVIS website and SR-NIEL framework for ISO-15390 model
As already shown in this webpage, the "LET" fluence Φ(LET) (e.g., see above discussion) can be derived using the following expression which allows one to correctly account for the overall particle flux in each bin:
(2),
where Φ(E) is the flux as a function of particle energy; ΔE and ΔLET are the extensions of the energy bin and of the corresponding mass electronic stopping power bin, respectively. Equation (2) is valid for ΔLET ≠ 0 and allows one to obtain the same particle fluence using either the integral of Φ(LET) over LET or Φ(E) over E:
(3).
Therefore, for each modulation model the Φ(LET) function - referred to as within the SR-NIEL framework - regarding the Fe-ions can be obtained using the Φ(E) spectral fluence and the values of the mass electronic stopping power as a function of Fe-ion energy available from the SRIM-based electronic stopping power calculator at the SR-NIEL website.
In Figure 5 (6) for CR2148 (CR2190) and ISO-15390 model, the Φ(LET) function - from SR-NIEL framework - computed from 1 up to 104 MeV/amu is compared to that one directly obtained from SPENVIS website; the mass electronic stopping power range (indicated as LET(Si)) varies from 1.1x10³ up to 2.9x10⁴ MeV cm2 g-1..
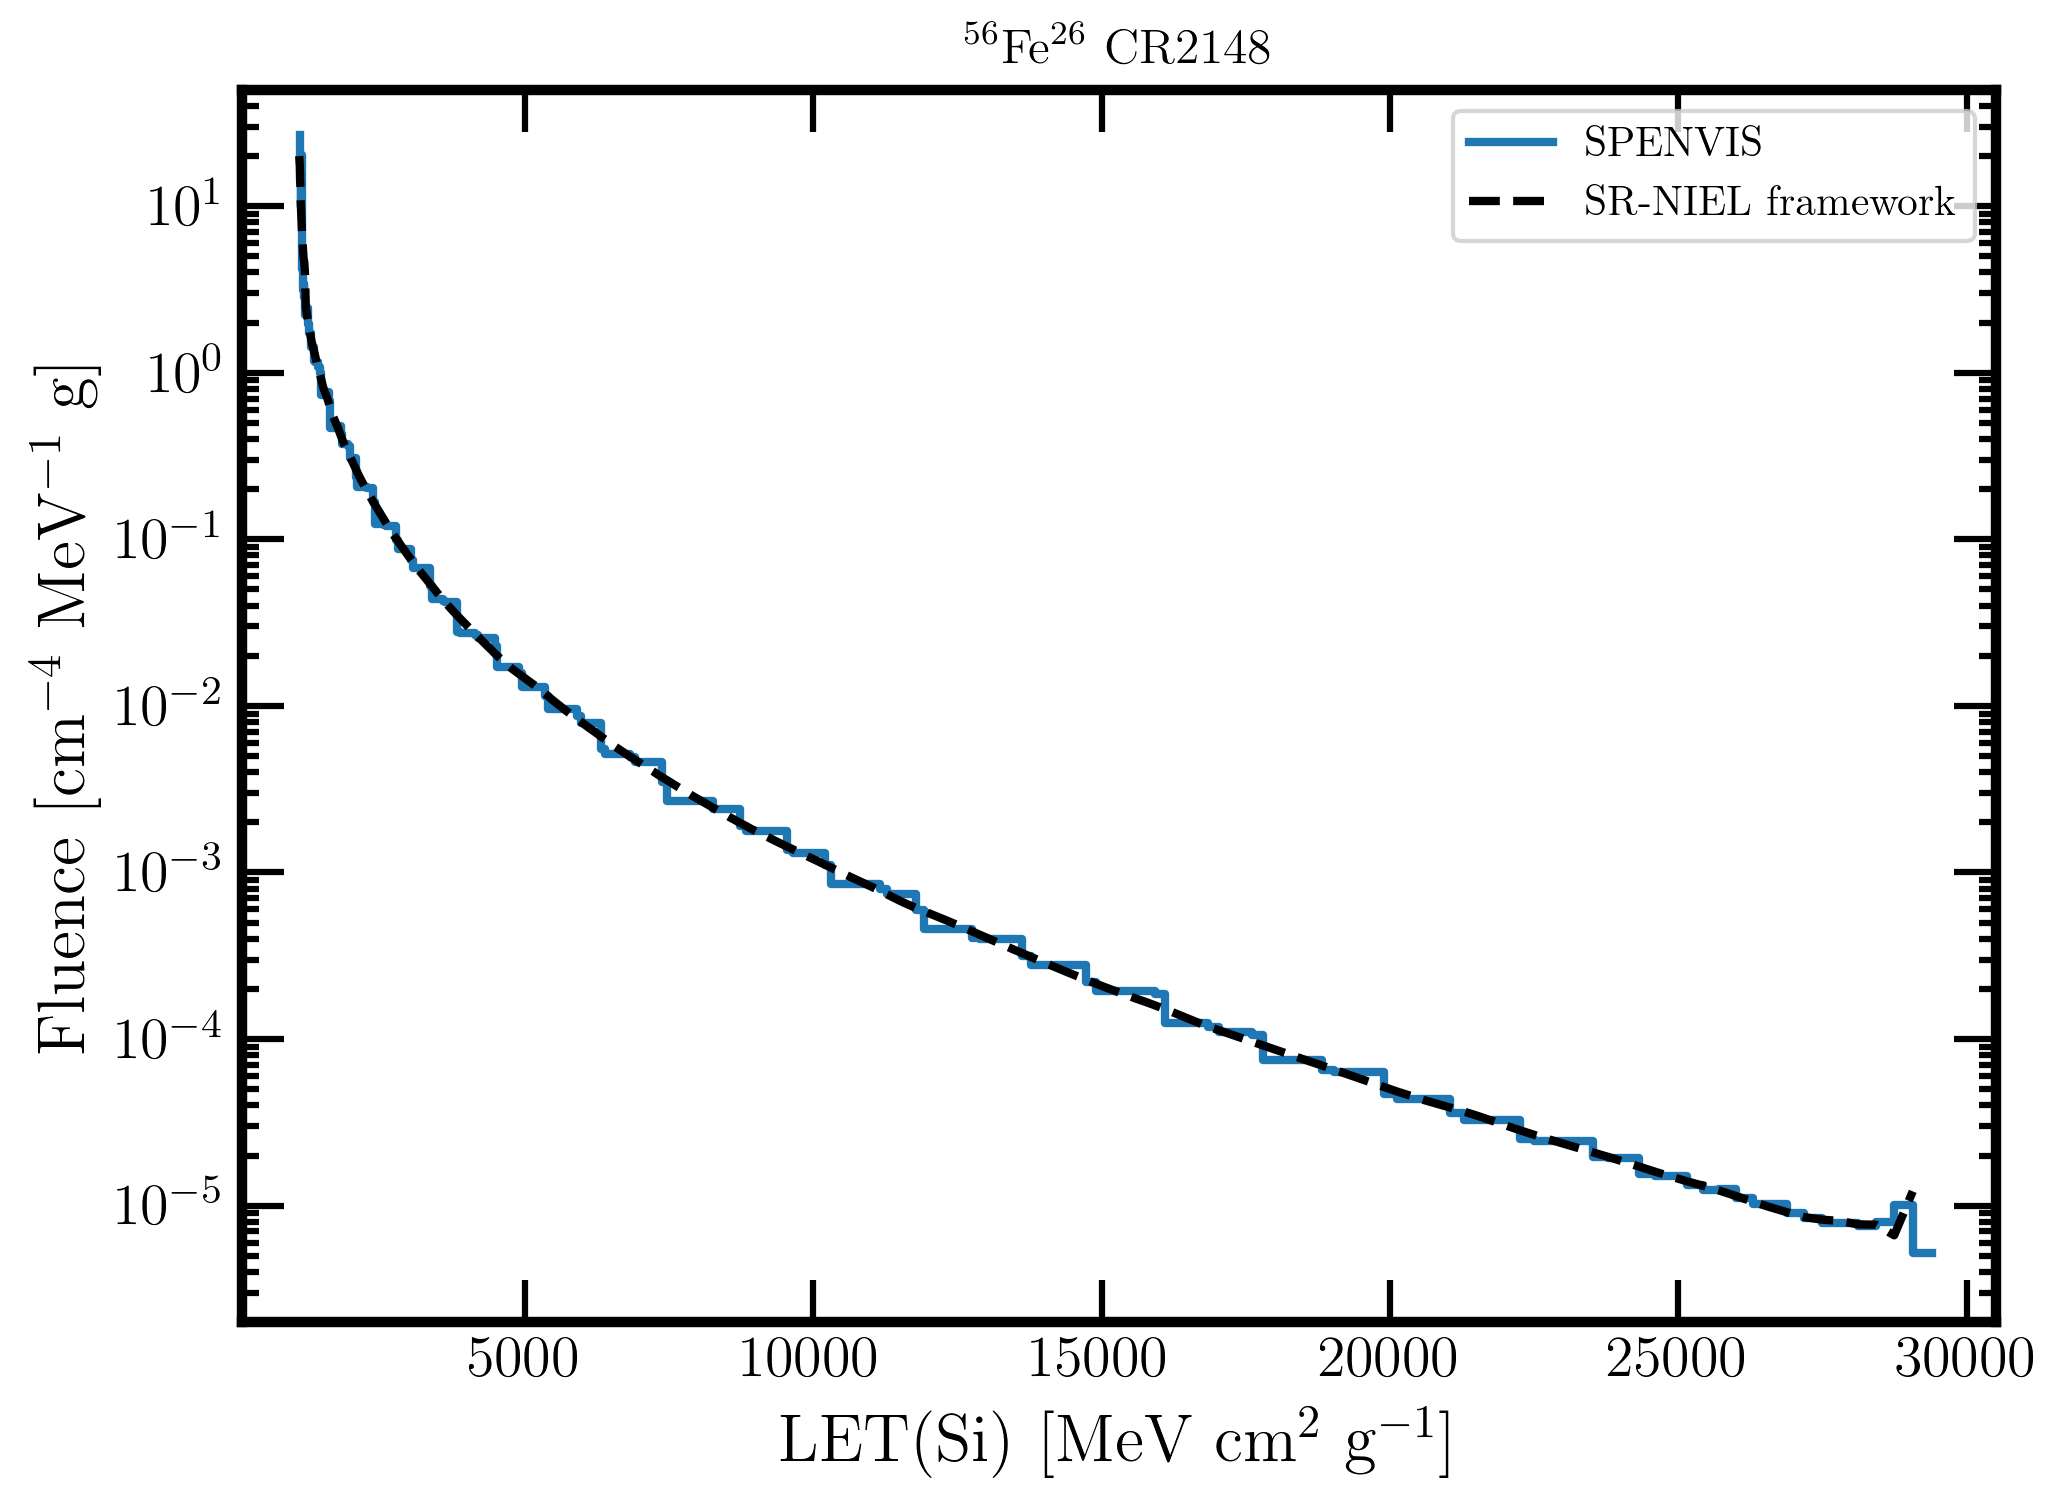
Figure 5. LET fluence in units of [cm-4 MeV-1 g] obtained from SPENVIS website (blue curve) and the one (black dashed curve) obtained within the SR-NIEL framework using Eq. (2) ( as discussed in the text) for CR2148 as a function of the mass electronic stopping power in silicon - indicated as LET(Si) - from 1.1x10³ up to 2.9x10⁴ MeV cm2 g-1.
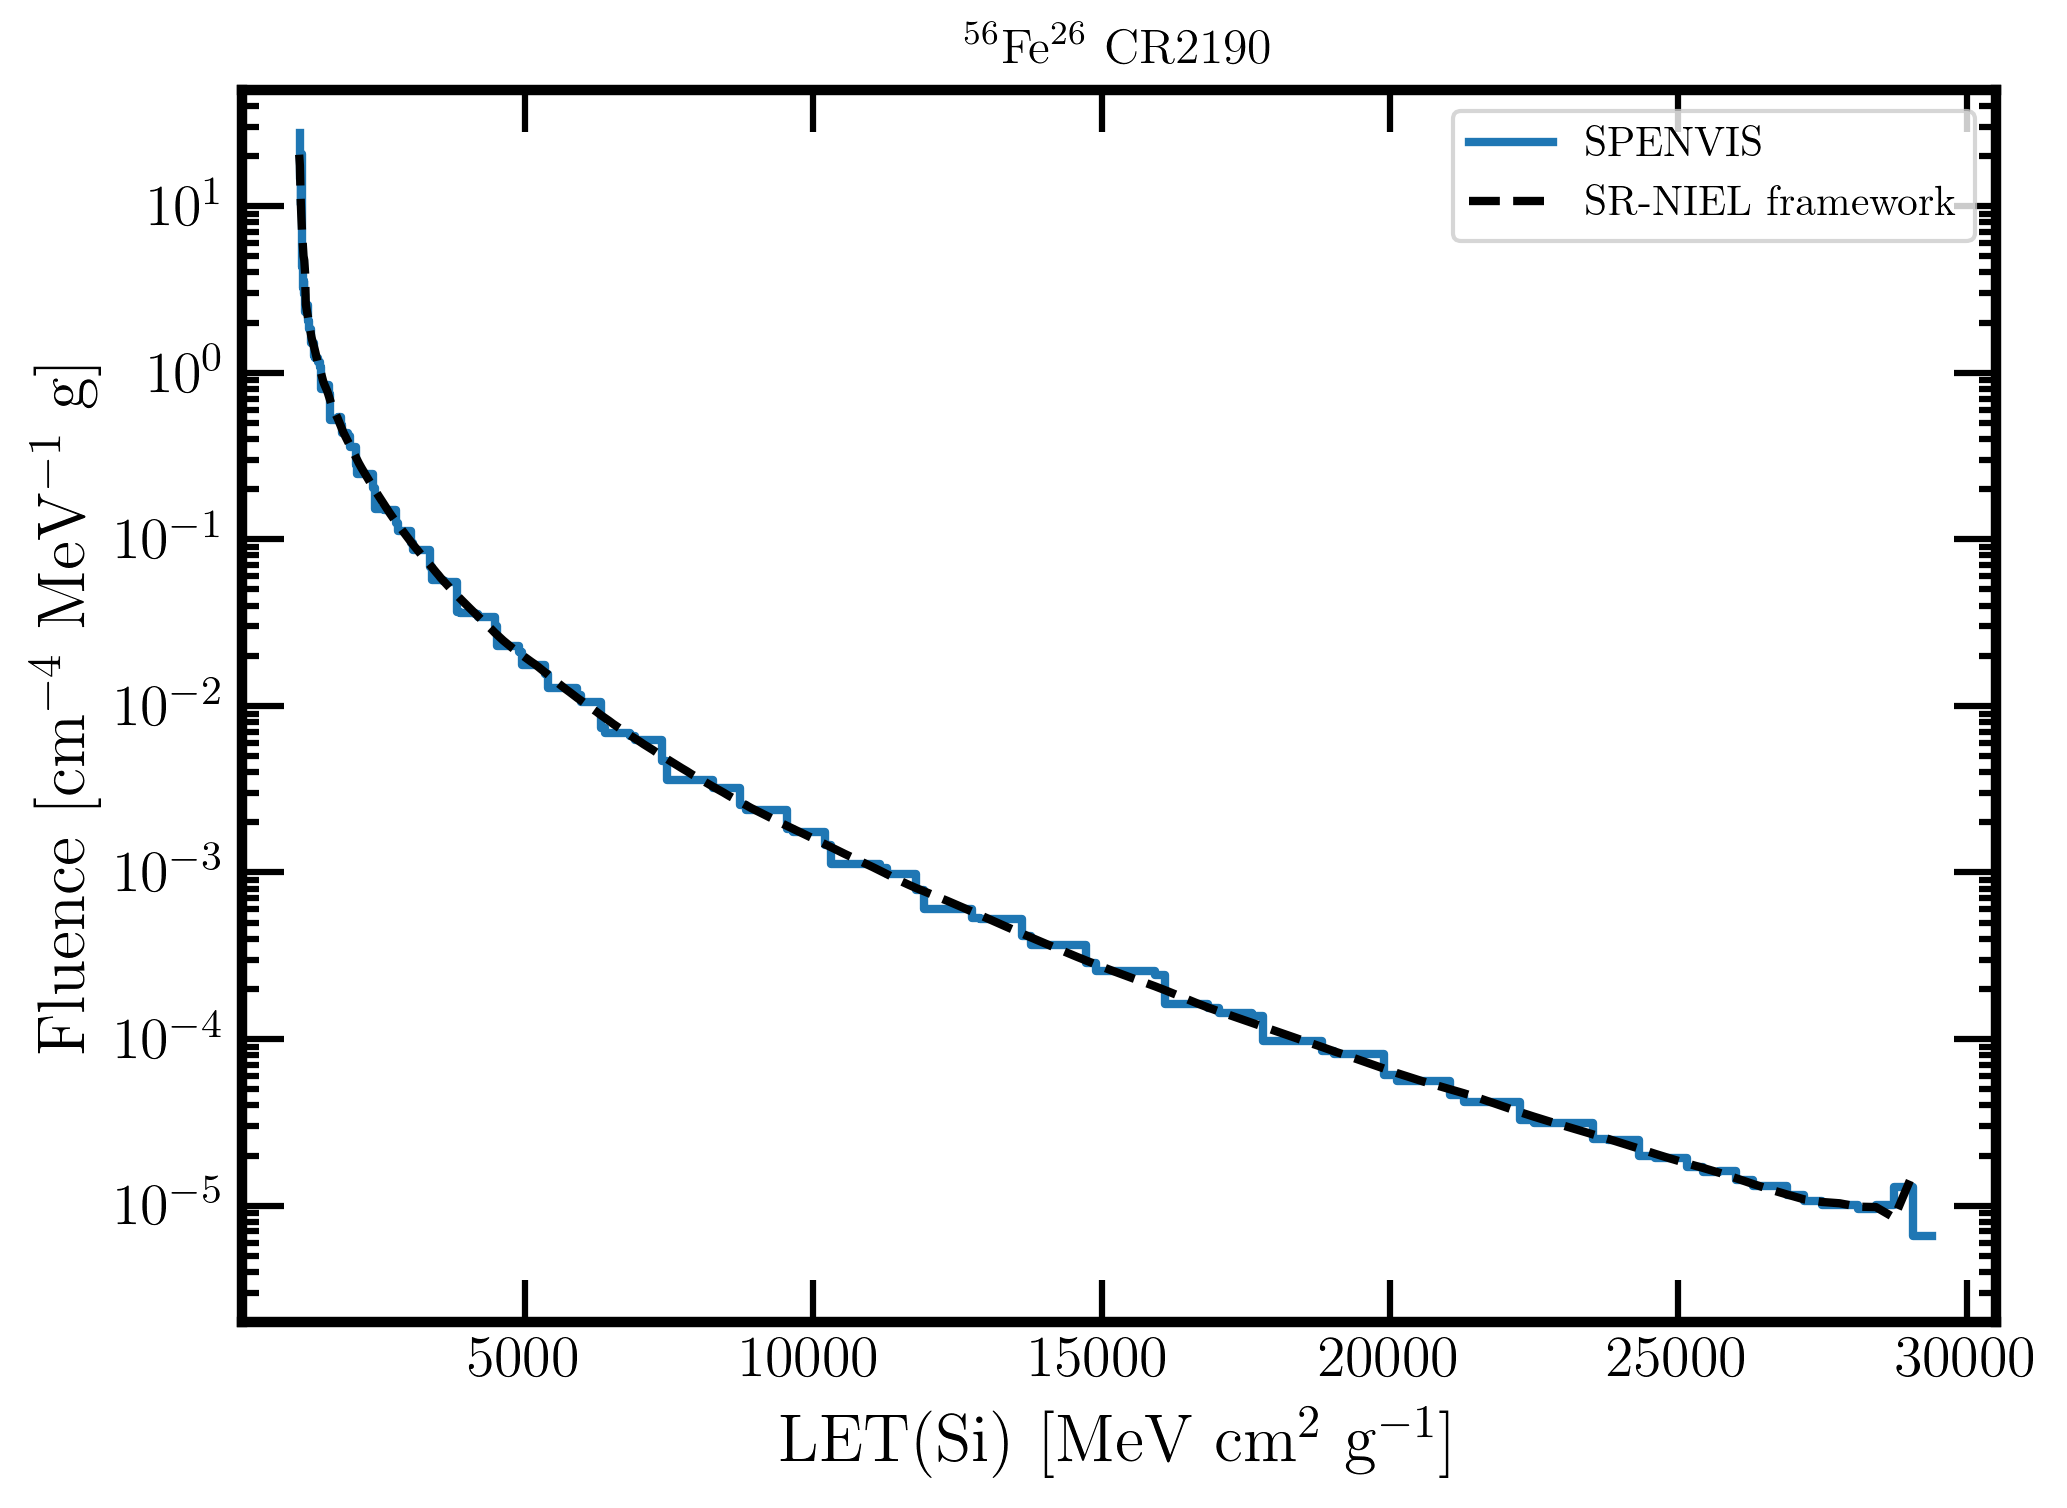
Figure 6. LET fluence in units of [cm-4 MeV-1 g] obtained from SPENVIS website (blue curve) and the one (black dashed curve) obtained within the SR-NIEL framework using Eq. (2) ( as discussed in the text) for CR2190 as a function of the mass electronic stopping power in silicon - indicated as LET(Si) - from 1.1x10³ up to 2.9x10⁴ MeV cm2 g-1.
The Fe-ion fluences for both SPENVIS data and that within the SR-NIEL framework for ISO-15390 model can be obtained using Eq. (3) and are reported in Table 3: the percentage difference between the two methods was found to be about 1.9% (1.8%) for CR2148 (CR2190).
| Method for LET fluence | CR2148 | CR2190 | ||
| Fluence [103 cm-2] |
Difference with respect |
Fluence [103 cm-2] |
Difference with respect |
|
| From SPENVIS | 2.02 | 1.9 | 2.17 | 1.8 |
| SR-NIEL framework | 1.99 | 0.0 | 2.13 | 0.0 |
Table 3. Fe-ion fluences for both SPENVIS data and that within the SR-NIEL framework for ISO-15390 model obtained using Eq. (3) for CR2148 and CR2190 in the mass electronic stopping power range from 1.1x10³ up to 2.9x10⁴ MeV cm2 g-1.
Estimated number of SEE as a function of modulation model
The number S of single event effects during Carrington rotations 2148 and 2190 can be computed as:
(4),
where Φ(LET) is the "LET " fluence as computed from Eqs. (2, 3) and σ(LET) is the SEE cross section as a function of mass electronic stopping power. Therefore (e.g., see previous section), the Φ(LET) functions are those obtained for each modulation model using the mass electronic stopping power for Fe-ions available from the SRIM-based electronic stopping power calculator at the SR-NIEL website from 44.5 up to 104 MeV/amu. Furthermore, in the following we will consider the particles as impinging perpendicularly on the front side of the absorbing medium when SEEs are evaluated.
For the current case study, the expected number (S) for SEEs is computed for the part type DAC5675A and it is based on the SEE cross section as a function of the mass electronic stopping power from HIREX (2010). In [HIREX (2010)], the SEE cross section for the part type DAC5675A (shown in Figure 5 at full scale current of 5 mA) is expressed by means of a four parameters Weibull function (for the formal equation see, for instance, Sect. 7 of [HIREX (2010)] and the discussion in Sect. 11.4.8.1 of [Leroy and Rancoita (2016)]) as a function of "LET" in MeV cm2 mg-1. The four parameters of the Weibull function at full scale current of 5 mA are reported in Table 2 of [HIREX (2010)]. The SEE cross section measurements were carried with N-, Ne-, Ar-, Fe-, Kr and Xe-ions at about (9.3-9.4) MeV/nucleon.
In Table 4, the expected numbers (S) of SEE for the part type DAC5675A are reported as a function of solar modulation model.
| Solar Modulation model |
CR2148 | CR2190 | ||
| S |
Difference with respect to HelMod [%] | S |
Difference with respect to HelMod [%] |
|
| CREME96 | 0.138 | -7.6 | 0.262 | -5.2 |
| CREME2009 | 0.183 | 24.5 | 0.277 | 0.4 |
| ISO-15390 | 0.205 | 36.8 | 0.229 | -16.9 |
| ISO-DLR | 0.209 | 39.6 | 0.310 | 12.3 |
| HelMod | 0.150 | - | 0.276 | - |
Table 4. The SEEs number S for the two CRs, calculated using Eq. (4) obtained as a function of solar modulation model. The integration limits corresponds to the Fe-ion energy range from 44.5 up to 104 MeV/amu. The percentage difference with respect to HelMod model is also reported.
By inspection of Table 4, one can remark that with respect to HelMod model (see, [HelMod (2019b)]) a) the expected number SEEs (S) from CREME96 modulation model (as available from CREME website) exhibits the lowest difference (-7.6%) for CR2148 (during high solar activity) and a similar (-5.2%) for CR2190 (low solar activity), while b) the expected number SEEs from ISO-15390 (as available from SPENVIS website) is overestimated by 36.8% for CR2148 (during high solar activity) and underestimated by 16.9% for CR2190 (low solar activity).
Bibliography:
[ANSI (2004)] American National Standards Institute, Space environment (natural and artificial) – Galactic cosmic ray model (2004). Tech. Rep. ISO 15390, Washington, D.C.. Retrieved from https://www.iso.org/standard/37095.html.
[CREME (1996)] Tylka, A. J. et al. (1997). CREME96: A Revision of the Cosmic Ray Effects on Micro-Electronics Code, IEEE Trans. Nucl. Sci., 44, 2150-2160, 1997.; Badhwar, G.D. and O'Neill, P.M. (1996), Galactic cosmic radiation model and its applications, Ad. Sp. Res. 17, 7-17; and also: Badhwar, G.D. and O'Neill, P.M. (1992), An improved model of galactic cosmic radiation for space exploration missions, International Journal of Radiation Applications and Instrumentation. Part D. Nuclear Tracks and Radiation Measurements, Volume 20, Issue 3, 403-410, https://doi.org/10.1016/1359-0189(92)90024-P.
[CREME (2012)] Adams, J.H. et al. (2012). CRÈME: The 2011 Revision of the Cosmic Ray Effects on Micro-Electronics Code, IEEE Tran. Nucl. Scie. 59, 3141 - 3147.
[ESCC-25100 (2014)] SINGLE EVENT EFFECTS TEST METHOD GUIDELINES (2014). ESCC Basic Specification No. 25100 issue 2, available at https://escies.org/webdocument/showArticle?id=229
[GalProp-HelMod (2016)] GalProp-HelMod (2016). As advertised on the GALPROP website, HelMod website can be used as a service package to seamlessly calculate the effects of the heliospheric modulation for GALPROP output files. FROM GalProp homepage: "We are pleased to inform the community of the launch of a new service HelMod, which can be used to seamlessly calculate the effects of the heliospheric modulation for GALPROP output file".
[ICRU-85 (2011)] ICRUM - International Commission on Radiation Units and Measurements (2011). FUNDAMENTAL QUANTITIES AND UNITS FOR IONIZING RADIATION (Revised), ICRU Report 85, Journal of the ICRU Volume 11 No 1, https://doi.org/10.1093/rpd/ncs077
[HelMod (2019a)] M.J. Boschini, S. Della Torre, M. Gervasi, G. La Vacca and P.G. Rancoita, The HelMod Model in the Works for Inner and Outer Heliosphere: from AMS to Voyager Probes Observations, Advances in Space Res 64 (2019), 2459-2476 - https://doi.org/10.1016/j.asr.2019.04.007 -; available also at the website: https://arxiv.org/abs/1903.07501.; see also Boschini, M. J. et al. (2018) HELMOD In The Works: From Direct Observations To The Local Interstellar Spectrum Of Cosmic-Ray Electrons Astrophys. J. 854(2):94, doi:10.3847/1538-4357/aaa75e; Boschini, M. J. et al. (2018) Deciphering the Local Interstellar Spectra of Primary Cosmic-Ray Species with HelMod. Astrophys. J. 858(1):61, doi:10.3847/1538-4357/aabc54; Boschini, M. J. et al. (2018), Propagation of Cosmic Rays in Heliosphere: the HelMod Model. Adv. Space Res., Volume 62, Issue 10, pages 2859-2879, 2018, doi:10.1016/j.asr.2017.04.017 ArXiv:1704.03733; Boschini, M. J. et al. (2017), Solution of Heliospheric Propagation: Unveiling the Local Interstellar Spectrum of Cosmic Rays Species Astrophysical Journal, 840:115, doi:10.3847/1538-4357/aa6e4f; Bobik et al. (2016), On the forward-backward-in-time approach for Monte Carlo solution of Parker's transport equation: One-dimensional case, Journal of Geophysical Research - Space Physics 121(5), 3920–3930, doi:10.1002/2015JA022237; Bobik, P. et al. (2012), Systematic Investigation of Solar Modulation of Galactic Protons for Solar Cycle 23 Using a Monte Carlo Approach with Particle Drift Effects and Latitudinal Dependence, Astrophys. J. 745:132, doi:10.1088/0004-637X/745/2/132.
[HelMod (2019b)] HelMod (2019b). The Fe-ion differential intensities were obtained from HelMod code [Ver. 4.0.0 - 01.May.2019] on Oct. 8 (2019). The Fe LIS (local interstellar spectrum) is not final and is based on current GalProp code normalization. At present, the Fe-LIS spectrum is under investigation by GalProp-HelMod (2016) join team and, possibly, an absolute scale decreasing of a few percents might be found.
[HIREX (2010)] HIREX (2010). Heavy Ion Test Report on part type DAC5675A - Rad-hard 14-bit 400MSPS D/A converter, Chip manufacturer: Texas Instruments -, report ref. HRX/SEE/0293, 26/7/2010.
[Leroy and Rancoita (2016)] C. Leroy and P.G. Rancoita (2016), Principles of Radiation Interaction in Matter and Detection - 4th Edition -, World Scientific. Singapore, ISBN-978-981-4603-18-8 (printed); ISBN.978-981-4603-19-5 (ebook); https://www.worldscientific.com/worldscibooks/10.1142/9167#t=aboutBook; it is also partially accessible via google books.
[Matthiä et al (2013)] Matthiä D., Berger T., Mrigakshi A. I., Reitz G. (2013), A ready-to-use galactic cosmic ray model, Advances in Space Research, Volume 51, Issue 3, Pages 329-338, https://doi.org/10.1016/j.asr.2012.09.022.
