Galactic cosmic rays, with energies ranging from hundreds or less of MeV up to TeVs, are mostly responsible for damages due to SEEs in satellite subsystems mostly through the electronic stopping power process (e.g., see Section on Effects of solar modulation on particle flux per unit area as a function of particle energy or electronic stopping power/restricted energy loss per unit length, i.e., on TID and SEE of the SR-NIEL Framework: Physics Handbook). Initially, the GCR transport through the heliosphere was addressed by Parker in the passage of energetic charged particles through interplanetary space (1965). In fact, the Parker Transport Equation, or Parker Equation, describes (1) the GCR diffusion by magnetic irregularities, (2) adiabatic energy changes related to cosmic radiation expansions and compressions, (3) the convection effect resulting from the solar wind velocity, and (4) drift effects linked to drift velocity. Drift velocity, crucially determined by the antisymmetric part of the diffusion tensor, depends on charge and Sun magnetic polarity configuration.
The unprecedented measurement aaccuracy of the AMS-02 experiment associated with data collected during more than a decade has significantly expanded our past knowledge of GCRs fluences at high energies, well beyond the corresponding tabulated values of the electronic stopping power from the SRIM code. Additionally, for particle energies approaching or above the ionization minimum, the actually deposited energy in a medium may be lower than that dealt from the electronic stopping power due to emitted delta-rays not being fully absorbed (i.e., the restricted energy-loss has to be accounted for). At very high energy, this effect cannot be neglected anymore (e.g., see Particle flux per unit area as a function of particle energy or electronic stopping power/restricted energy loss per unit length, and relevance of solar modulation effects). Currently, the SR-NIEL website includes the so-called SR-framework electronic stopping power treatment, which extends the energy ranges covered by SRIM up to ultra-high energies. The related web calculators are available in the section Electronic Stopping Power Calculators (and TID doses) for protons, ions and electrons; Radiative Stopping Power for electrons. A further web calculator section is dedicated to Restricted Energy-Loss (and TID doses) Calculators within SR-framework of electronic stopping poweRestricted Energy-Loss (and TID doses) Calculators within SR-framework of electronic stopping power.
As discussed previously, since a device is usually not thick enough to fully absorb secondary δ-rays, the energy loss suffered by the incoming particle differs from the one deposited inside the traversed medium. As a consequence, the escaped δ-rays result in an effective detectable maximum transferred energy (indicated as W0 in the following) and, in turn, the deposited energy will reach a constant value, called the Fermi plateau at very high energy. Thus, when the energy deposited into an absorber or a device has to be considered, one has to deal with the so-called restricted energy loss - for instance, see the treatment by Fano (1963) - in which the effective detectable maximum transferred energy is accounted for (e.g., see Sect. 2.1.1.4 in [Leroy and Rancoita (2016)]). Finally, it has to be remarked that the electronic stopping power accounts for the energy lost by the incoming particle.
In the following discussion, we will treat a few properties regarding how the usage of the restricted energy loss (to account for the energy deposited in a medium or in a device) may affect the estimate for cumulative effects (e.g., when the expected ionizing dose is evaluated) and non-cumulative effects (for instance, when the expected rate of single event effects (SEE) is evaluated). In addition, the electronic stopping power and/or the restricted energy loss are referred to the energy of the particle entering the medium, i.e., effects due to changes in the incoming particle energy are not taken into account. The medium taken into consideration is silicon, most employed in manufacturing semiconductor devices for space applications.
One has to remark that the physical mechanism of energy deposition per unit length in a medium (thus, the resulting computed value of restricted energy loss) depends on the overall traversed path to which W0 is related. Therefore in the following we will consider the particles as impinging perpendicularly on the front side of the absorbing medium when both SEEs and amounts of energy deposited are evaluated. The electronic stopping power, on the other hand, does not depend on the incoming particle direction with respect to the medium surface.
The text is organized in sections:
- A case study for cumulative effects regarding the expected ionizing dose,
- A case study for non-cumulative effects regarding the expected rate of single event effects (SEE).
A case study for cumulative effects regarding the expected ionizing dose
For the case study on cumulative effect imparting a ionizing dose, the particle fluence is the one expected for JUICE mission: the spectral fluence data are calculated with JOREM Model implemented in SPENVIS assuming a 4π solid angle exposure. In Figure 1, the derived spectral fluence Φ(E) for the JUICE mission as a function of proton energy is shown in free space (black curve) and after traversing 50 and 100 mils of aluminum (obtained using a sr-niel calculator). As already mentioned, the particles are supposed to strike perpendicularly the front side of the absorbing medium (silicon).
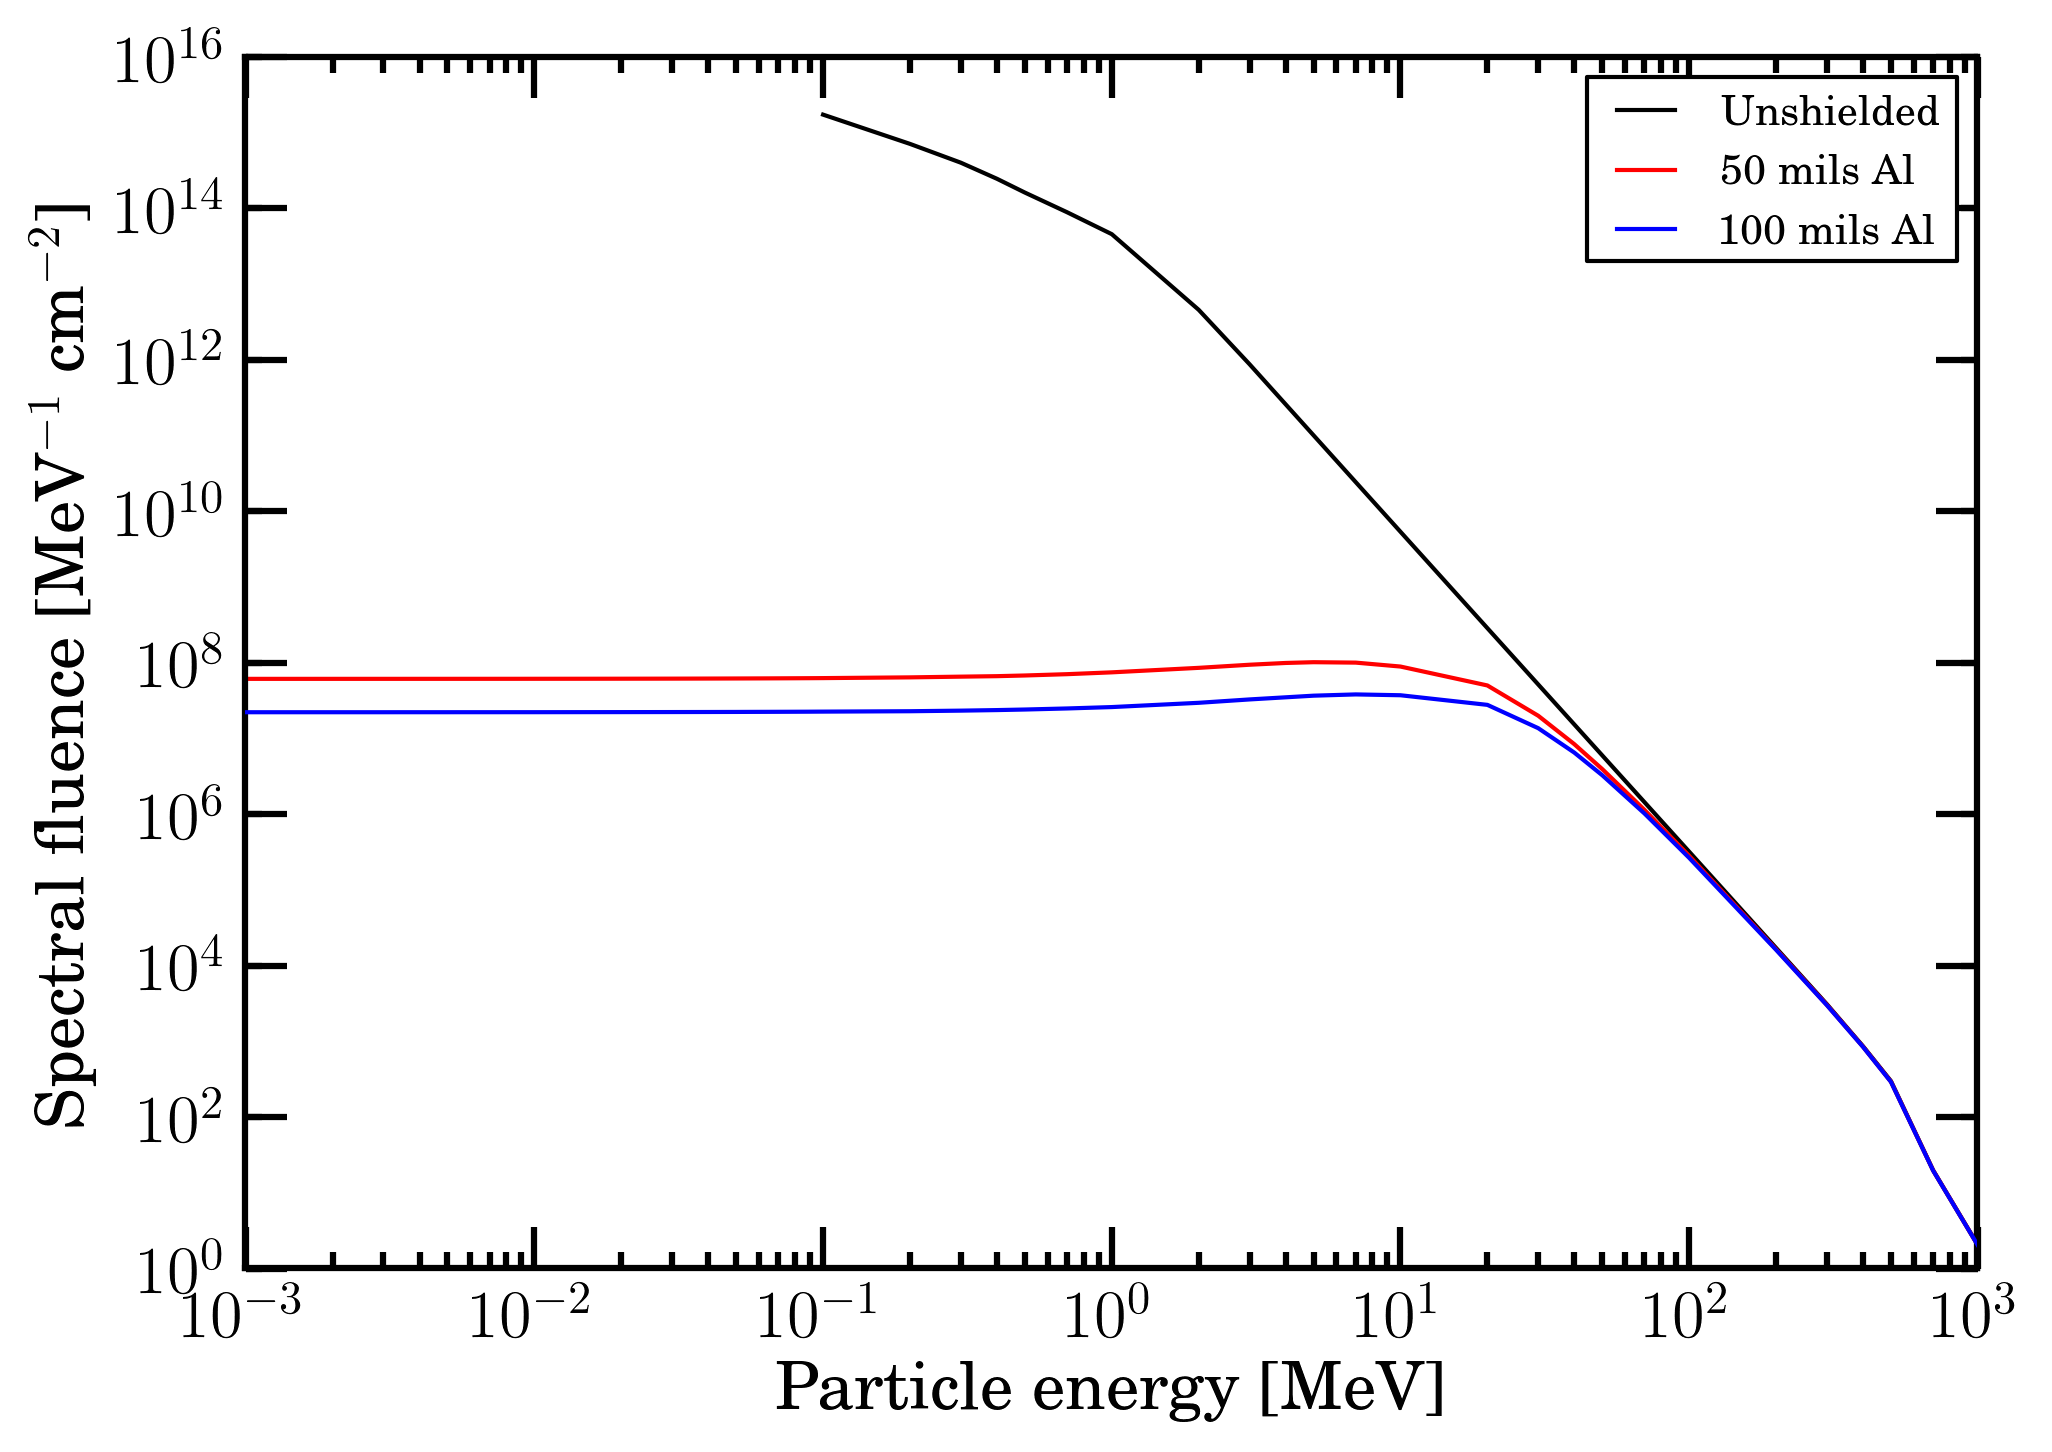 Figure 1. Spectral fluence, Φ(E), as a function of proton energy for the JUICE mission (black curve). The red (blue) curve is the residual fluence after traversing 50 (100) mils of Al.
The energy lost per g of absorber (indicated as R) can be computed using the spectral fluence Φ(E), as: 
where ESP is the mass electronic stopping power, i.e, that one from SRIM or from the electronic stopping power used in SR-framework (the reader can access this webpage regarding its dervation). The quantity R can also be computed using the mass restricted energy-loss treated in this webpage, as:
![]()
where REL is the mass restricted energy loss, which in turn depends on the value of W0, i.e., effective detectable maximum transferred energy for the device under consideration. In the latter case the quantity R provides a close estimate of the total ionizing dose (TID) imparted to the device.
The value of R are reported in Table 1 for the JUICE mission spectral fluence in free space (in black) and after traversing 50 (red data) and 100 (blue data) mils of aluminum.
| R [MeV g-1] (free space) |
R [MeV g-1] (50 mils Al) |
R [MeV g-1] (100 mils Al) |
|
| mass stopping power from SRIM | 9.53E+16 | 1.01E+11 | 4.11E+10 |
| mass stopping power in SR-framework | 9.53E+16 | 1.01E+11 | 4.10E+10 |
| mass restricted energy loss (W0=500keV) | 9.53E+16 | 1.01E+11 | 4.10E+10 |
| mass restricted energy loss (W0=300keV) | 9.53E+16 | 1.01E+11 | 4.10E+10 |
| mass restricted energy loss (W0=100keV) | 9.53E+16 | 1.01E+11 | 4.10E+10 |
| mass restricted energy loss (W0= 30keV) | 9.53E+16 | 1.00E+11 | 4.06E+10 |
Table 1. R values (for silicon absorber) calculated using Eqs. (1) for the mass electronic stopping powers from SRIM and from SR-framework; and using Eq. (2) for the mass restricted energy loss with W0 = 500, 300, 100 and 30 keV. R was obtained for the JUICE mission spectral fluence in free space (in black) and after traversing 50 (red data) and 100 (blue data) mils of aluminum.
By inspection of Table 1, one may note that the values of R obtained from SRIM and from SR-framework are in full agreement. In addition at these low proton energies, the impact of replacing the electronic stopping power with the appropriate restricted energy loss is only at the 1% level in case of thin active layers from which δ-ray electrons can escape for energies larger than 30 keV.
A case study for non-cumulative effects regarding the expected rate of single event effects (SEE)
For the case study on non-cumulative effect resulting in a SEE, the Fe-ions differential intensities (Figure 2) in [m2 · sr · s · GV]−1 were obtained, at 1 AU, from [HelMod (2019)] for Carrington rotations 2148 (March 11, 2014 - April 7, 2014) and 2190 (April 29, 2017 - May 26, 2017) with solar conditions close to those of AMS-02 proton observations regarding the Bartels rotations 2464 (March 6, 2014 - April 1, 2014) and 2506 (April 13, 2017 - May 9, 2017) and discussed in this webpage. The solar modulation affects, indeed, the energy dependence of particle spectra. The lowest limit of the Fe-ion differential intensities is about 2.49 GeV, i.e., from about 0.11 GeV above the kinetic energy threshold for allowing an Fe-ion to emerge, when the incoming particle strikes perpendicularly an Al absorber with a thickness of 50 mils (see the discussion in this webpage).
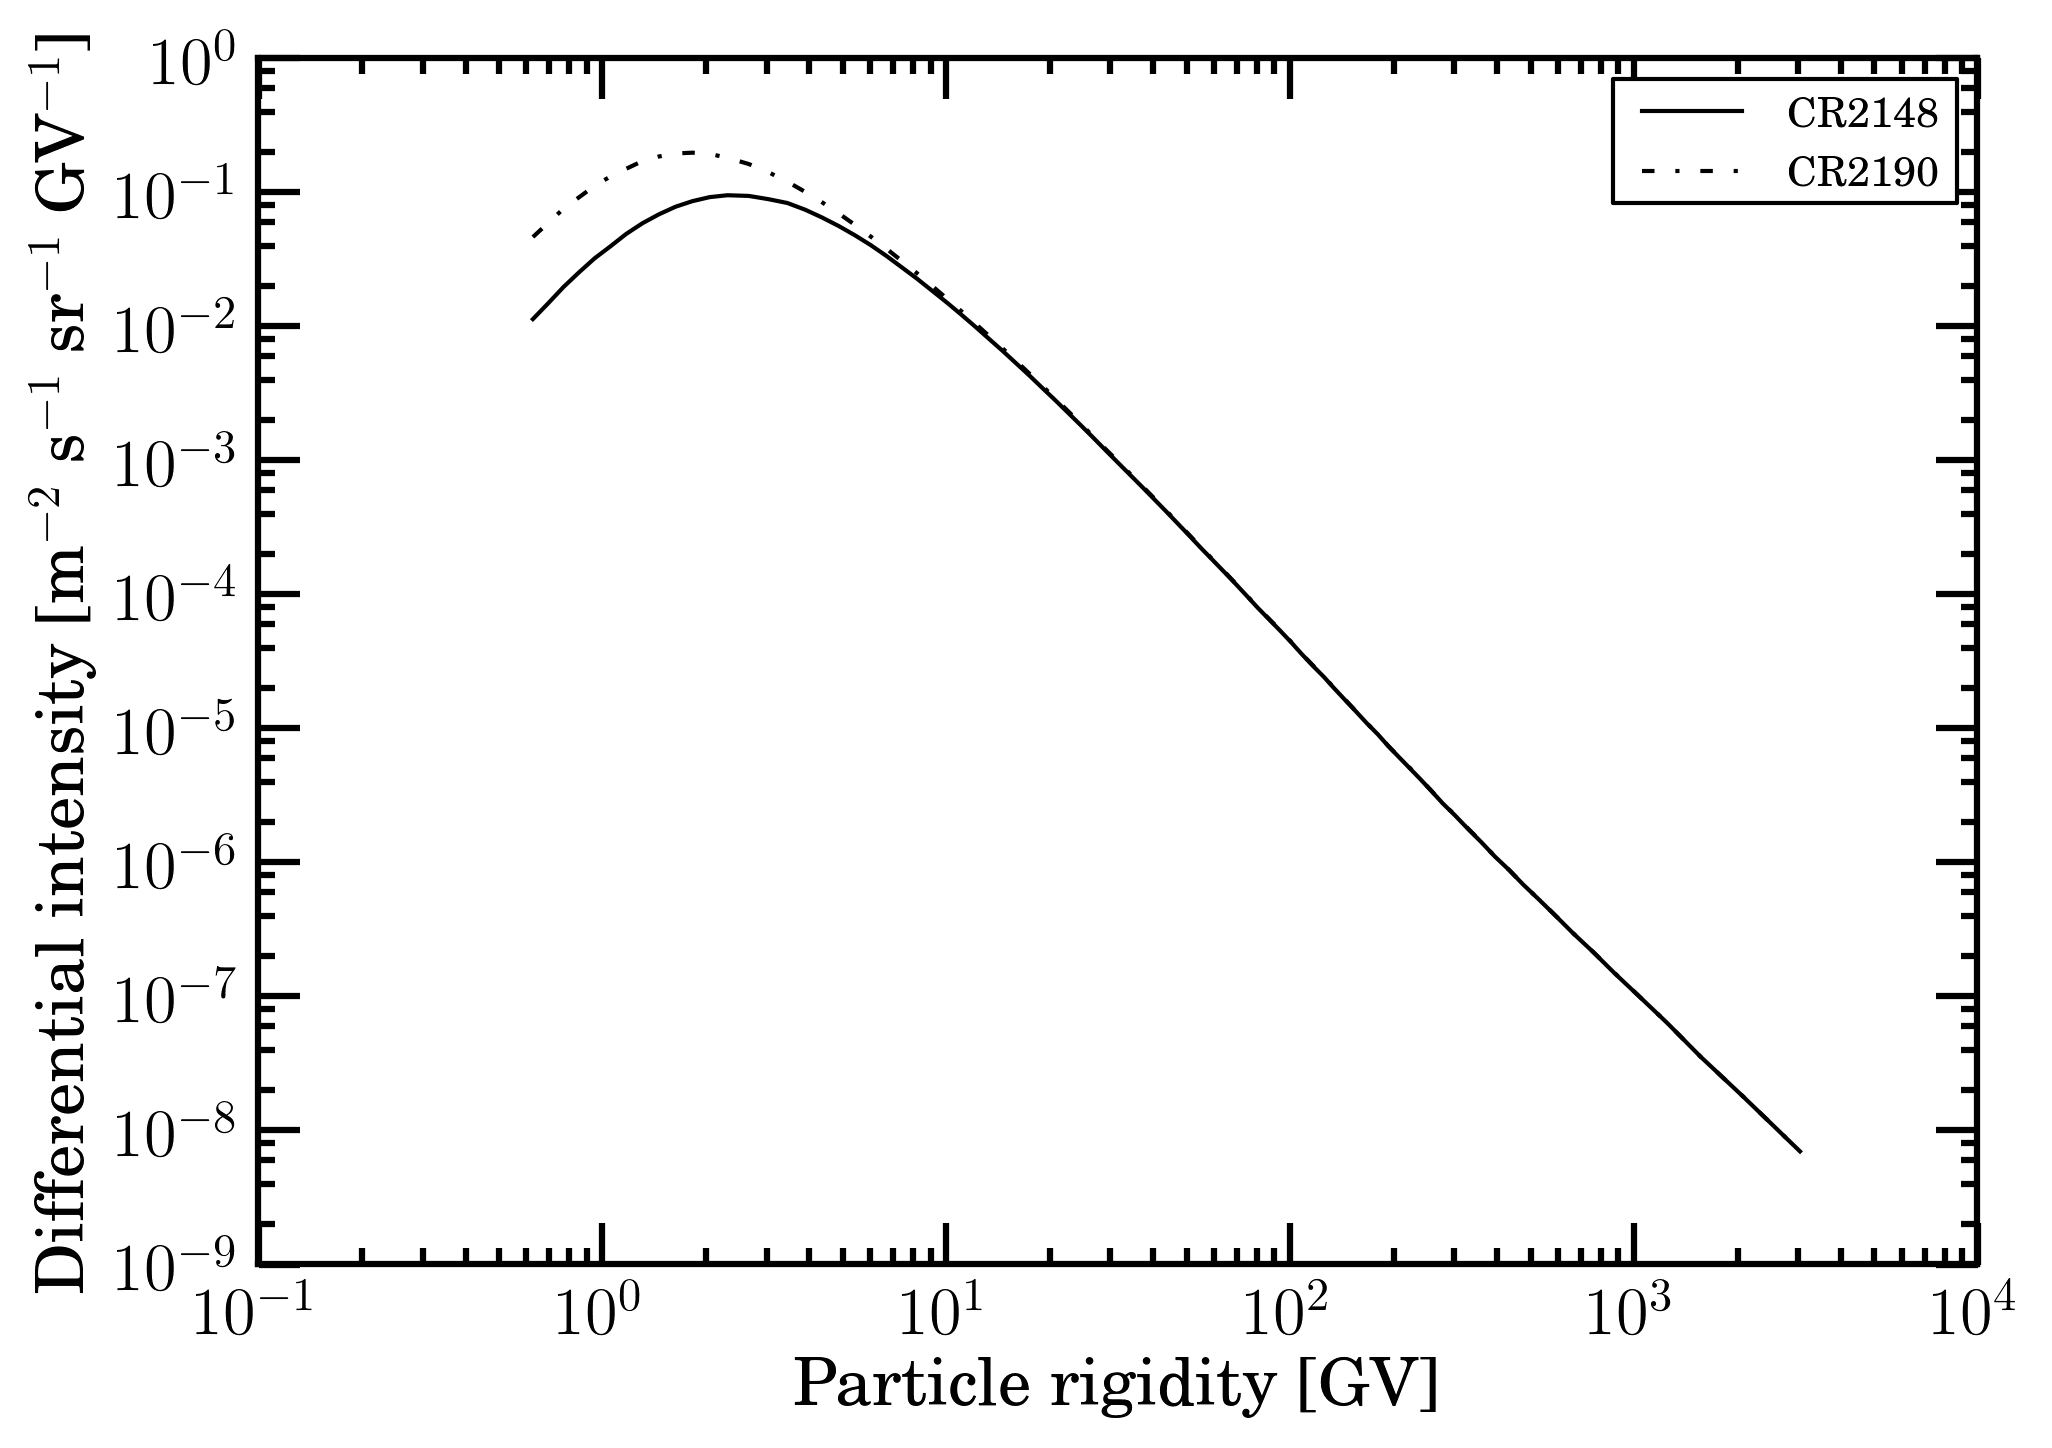 Figure 2. Fe-ion differential intensities in units of [m2 · sr · s · GV]−1 obtained using HelMod code for Carrington rotations 2148 (March 11, 2014 - April 7, 2014) and 2190 (April 29, 2017 - May 26, 2017) from 0.62 GV up to 3.4 TV. The Carrington rotation duration is 2 356 992 s.
For the current case study, the expected rate for SEE is computed for a Rad-hard 14-bit 400MSPS D/A converter (i.e., the part type DAC5675A discussed in [HIREX (2010)]) and it is based on the SEE cross section as a function of the electronic stopping power from . As discussed in this , treatments using the particle distributions as a function of energy or electronic stopping power yield equivalent results when the appropriate transformations are implemented. Therefore, in the present case, the SEE cross section as a function of particle energy is needed in order to deal with Fe-ions spectral fluences provided by (see also []). In Figures 3 and 4, the Fe-ion spectral fluences are shown for the free space and as residual spectral fluences after traversing 50 and 100 mils of Al absorber (i.e., as obtained using this ).
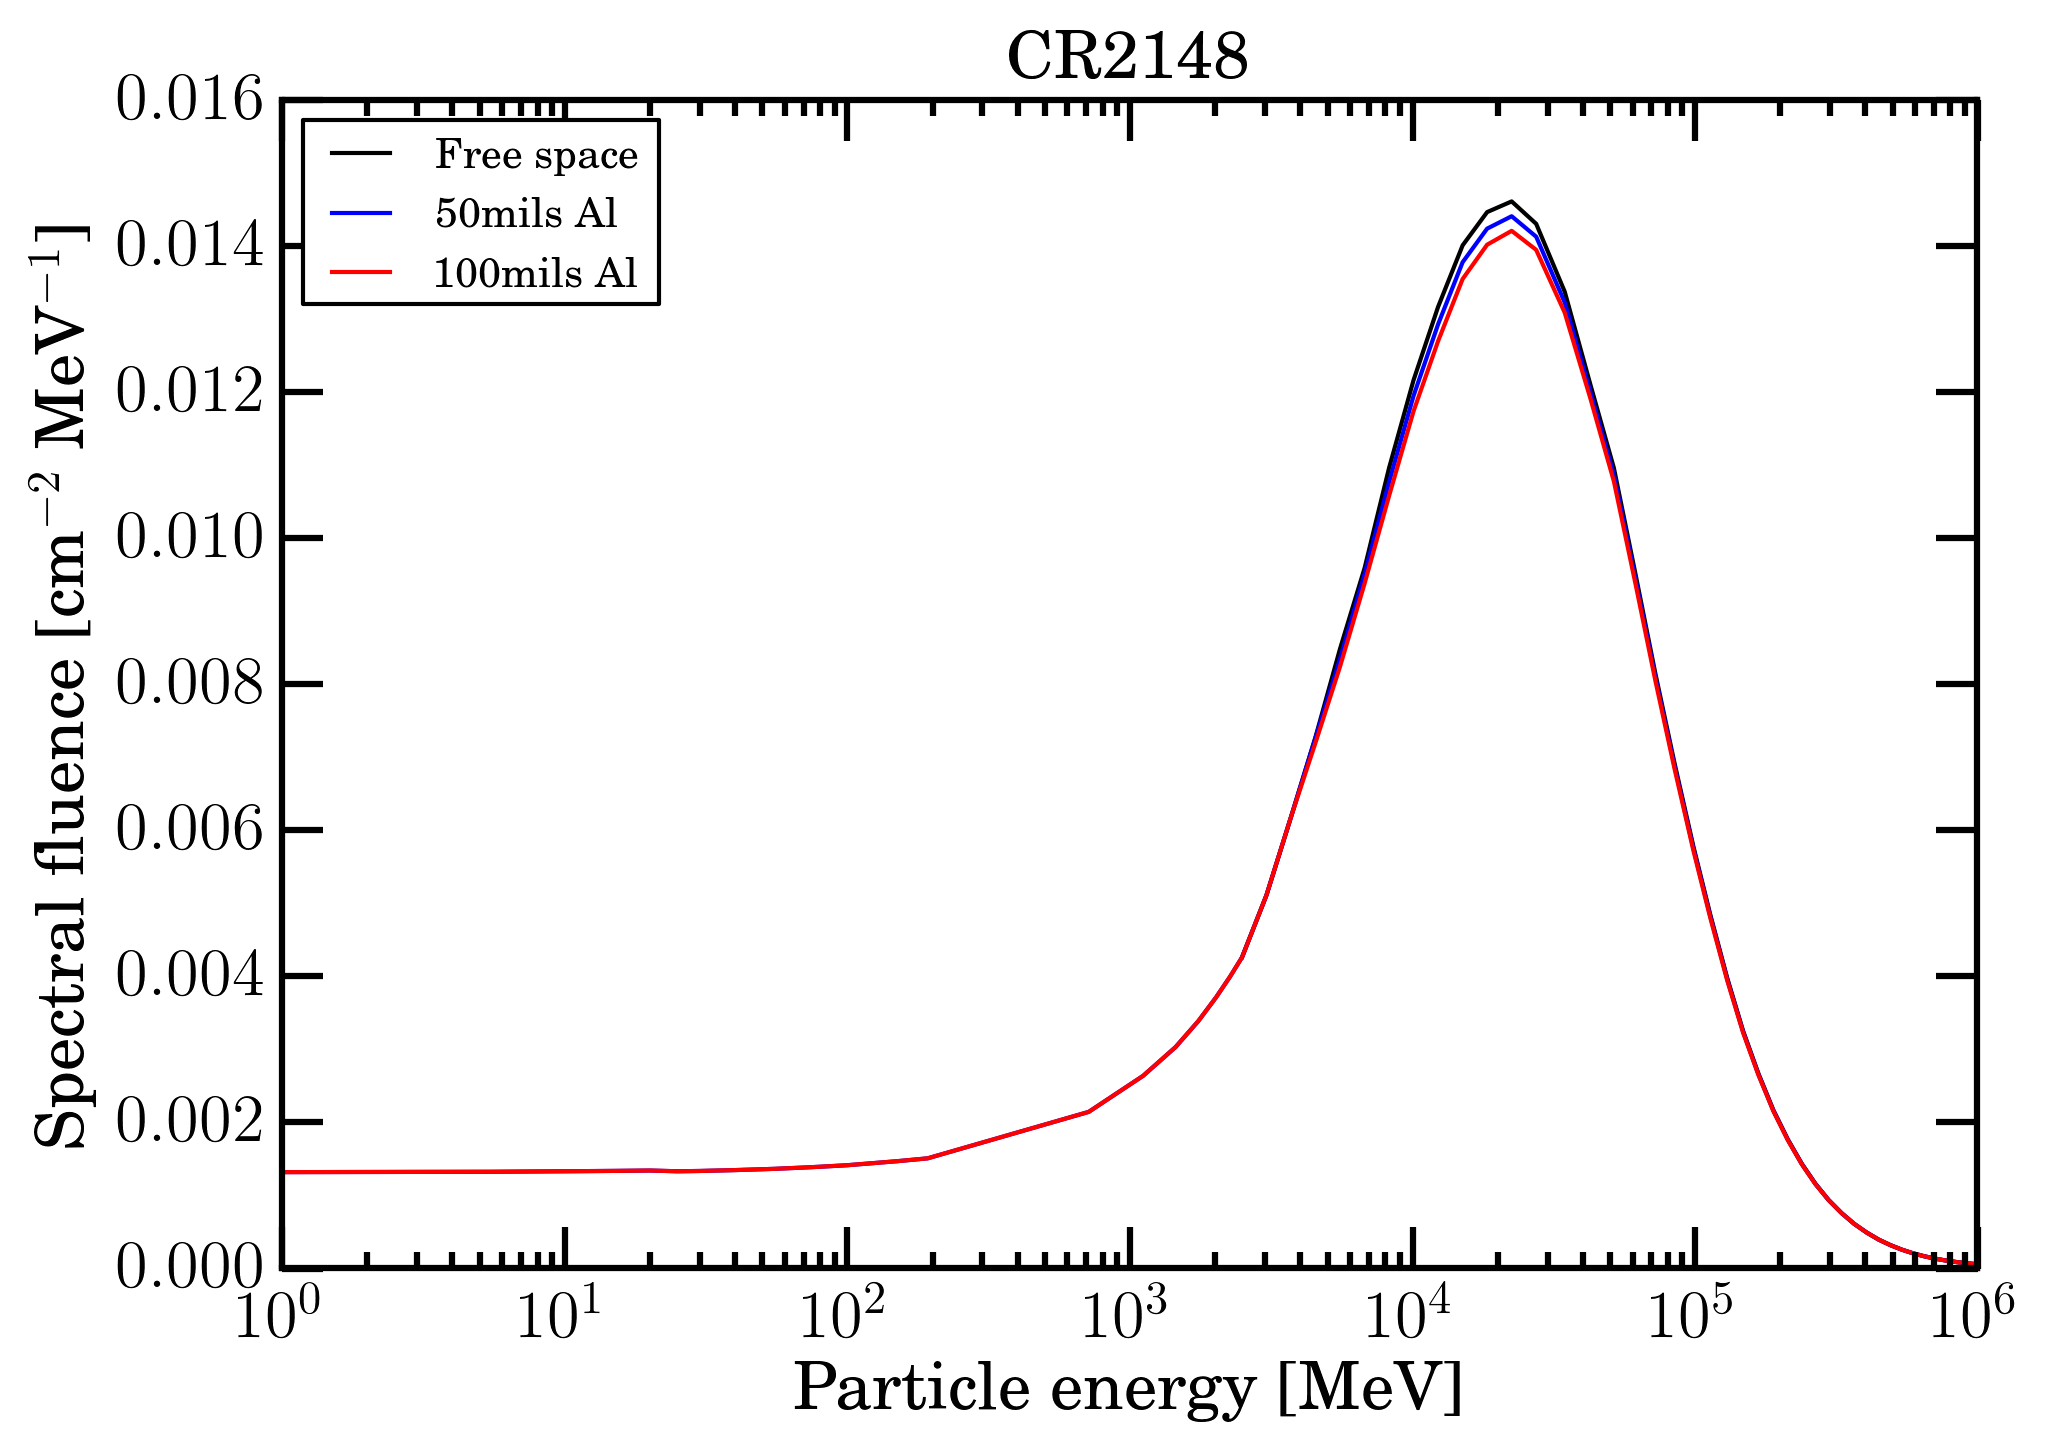 Figure 3. Fe-ion fluences in units of [ MeV cm2 ]−1 as a function of energy from 1 MeV for Carrington rotation 2148 in free space (black curve); the red (blue) curve is the residual fluence after traversing 50 (100) mils of Al (obtained using this sr-niel calculator).
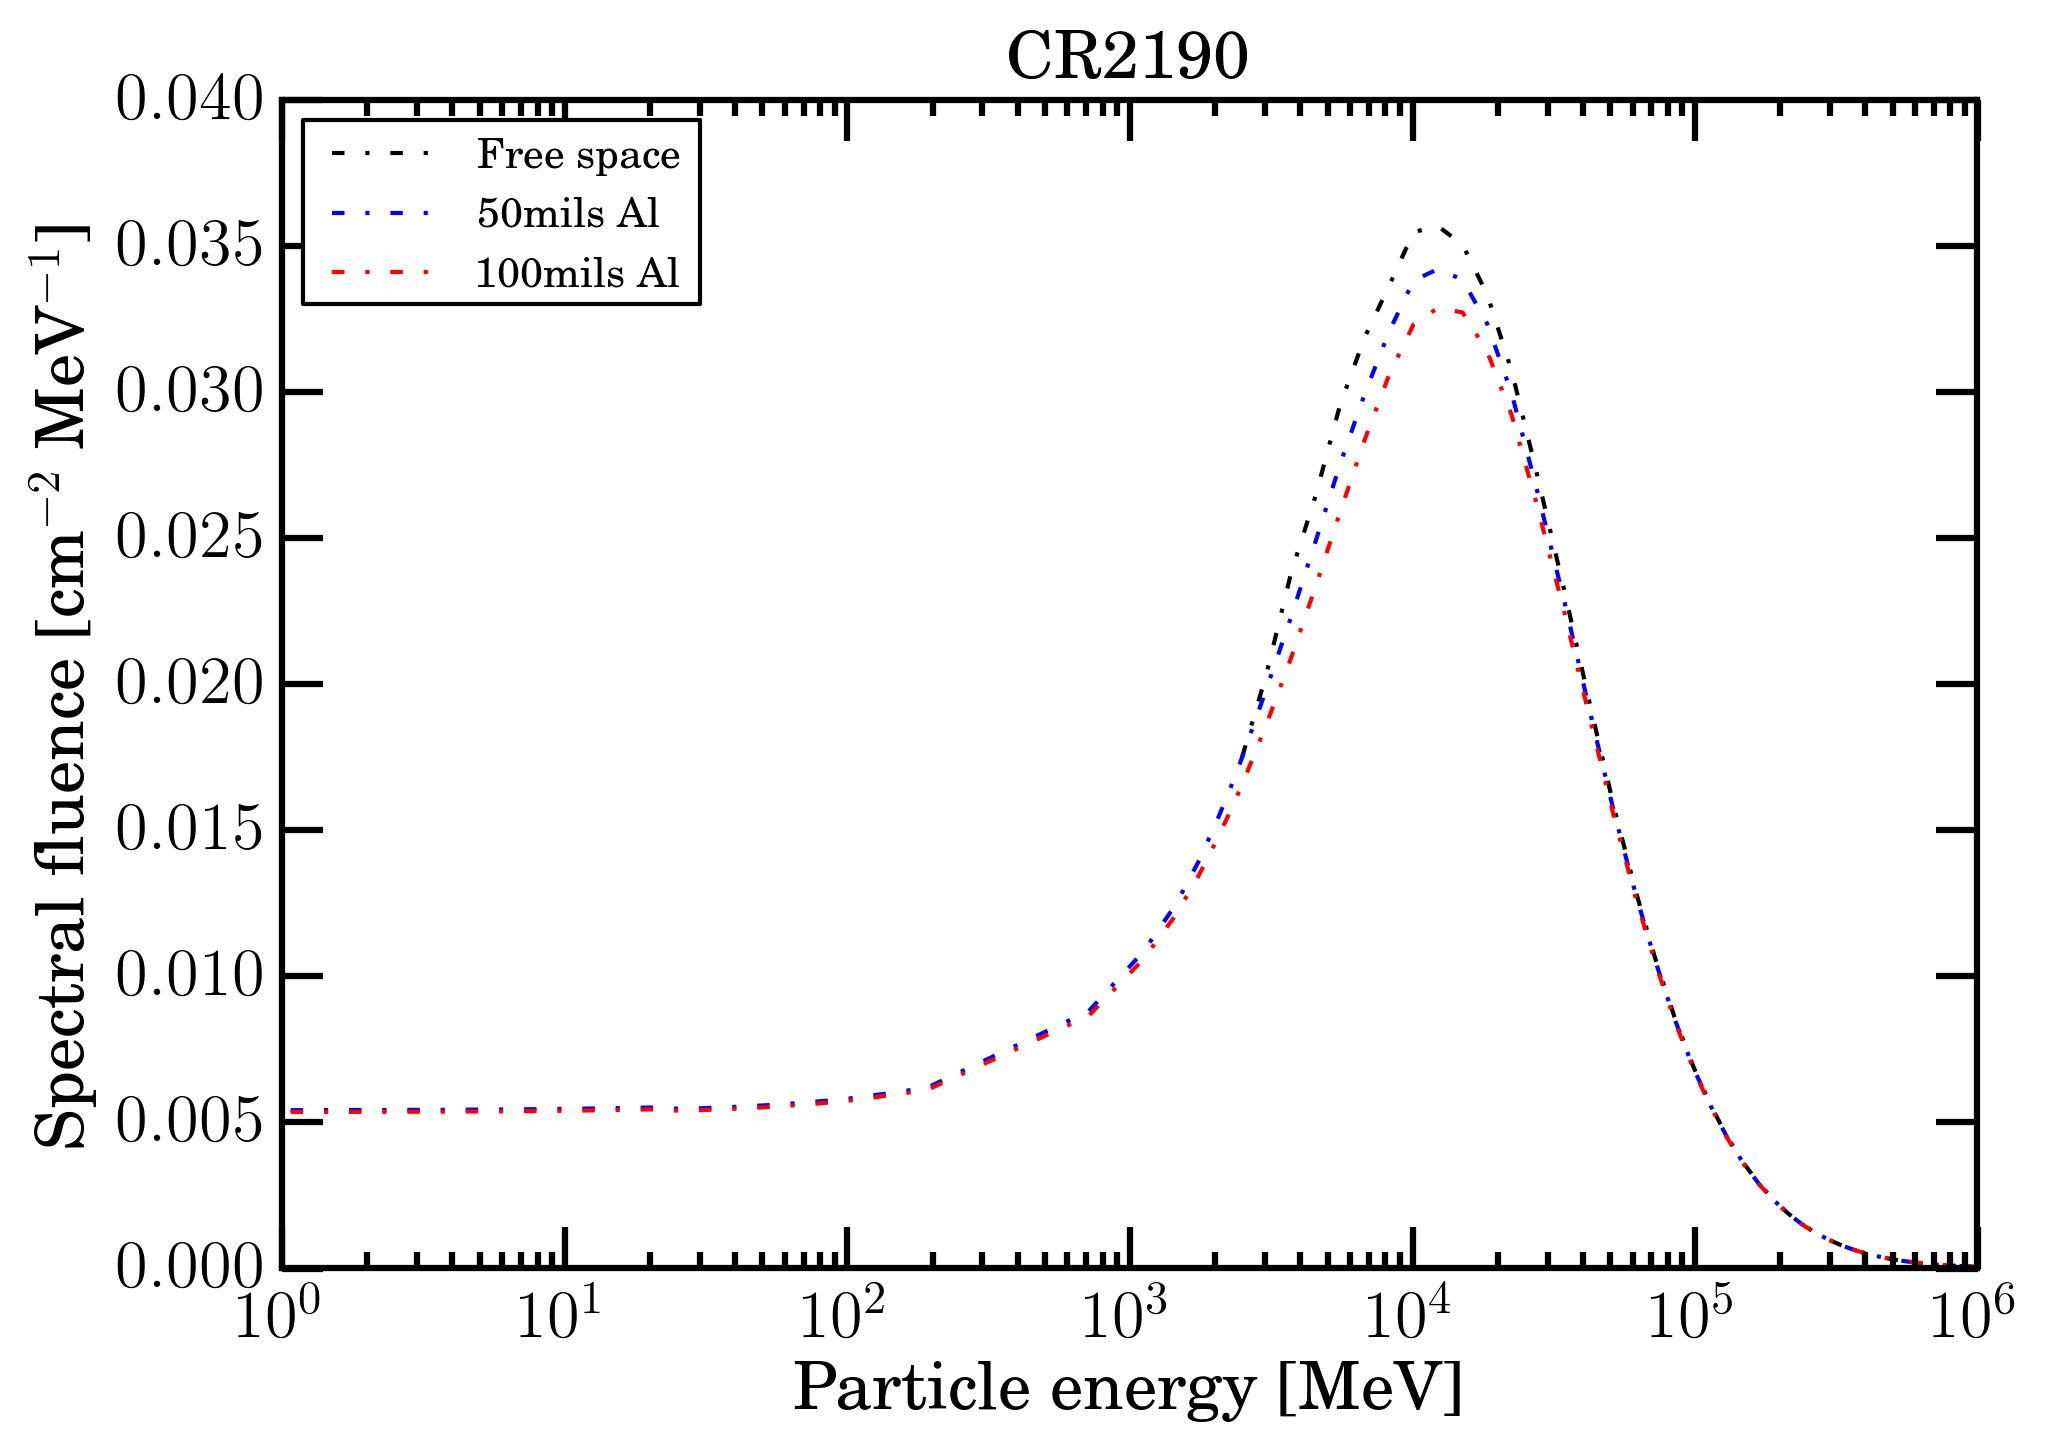 Figure 4. Fe-ion fluences in units of [ MeV cm2 ]−1 as a function of energy from 1 MeV for Carrington rotation 2190 in free space (black curve); the red (blue) curve is the residual fluence after traversing 50 (100) mils of Al (obtained using an sr-niel calculator).
SEE cross section as a function of particle energy
In [HIREX (2010)], the SEE cross section for the part type DAC5675A (shown in Figure 5 at full scale current of 5 mA) is expressed by means of a four parameters Weibull function (for the formal equation see, for instance, Sect. 7 of [HIREX (2010)] and the discussion in Sect. 11.4.8.1 of [Leroy and Rancoita (2016)]) as a function of "LET" in MeV cm2 mg-1 (see this webpage about Linear Energy Transfer, LET, and electronic stopping power). The four parameters of the Weibull function at full scale current of 5 mA are reported in Table 2 of [HIREX (2010)]. The SEE cross section measurements were carried with N-, Ne-, Ar-, Fe-, Kr and Xe-ions at about (9.3-9.4) MeV/nucleon. At these energies the difference between the deposited and lost by the incoming particle is expected to be marginal in the entire range of W0 taken into consideration (e.g., see this webpage).
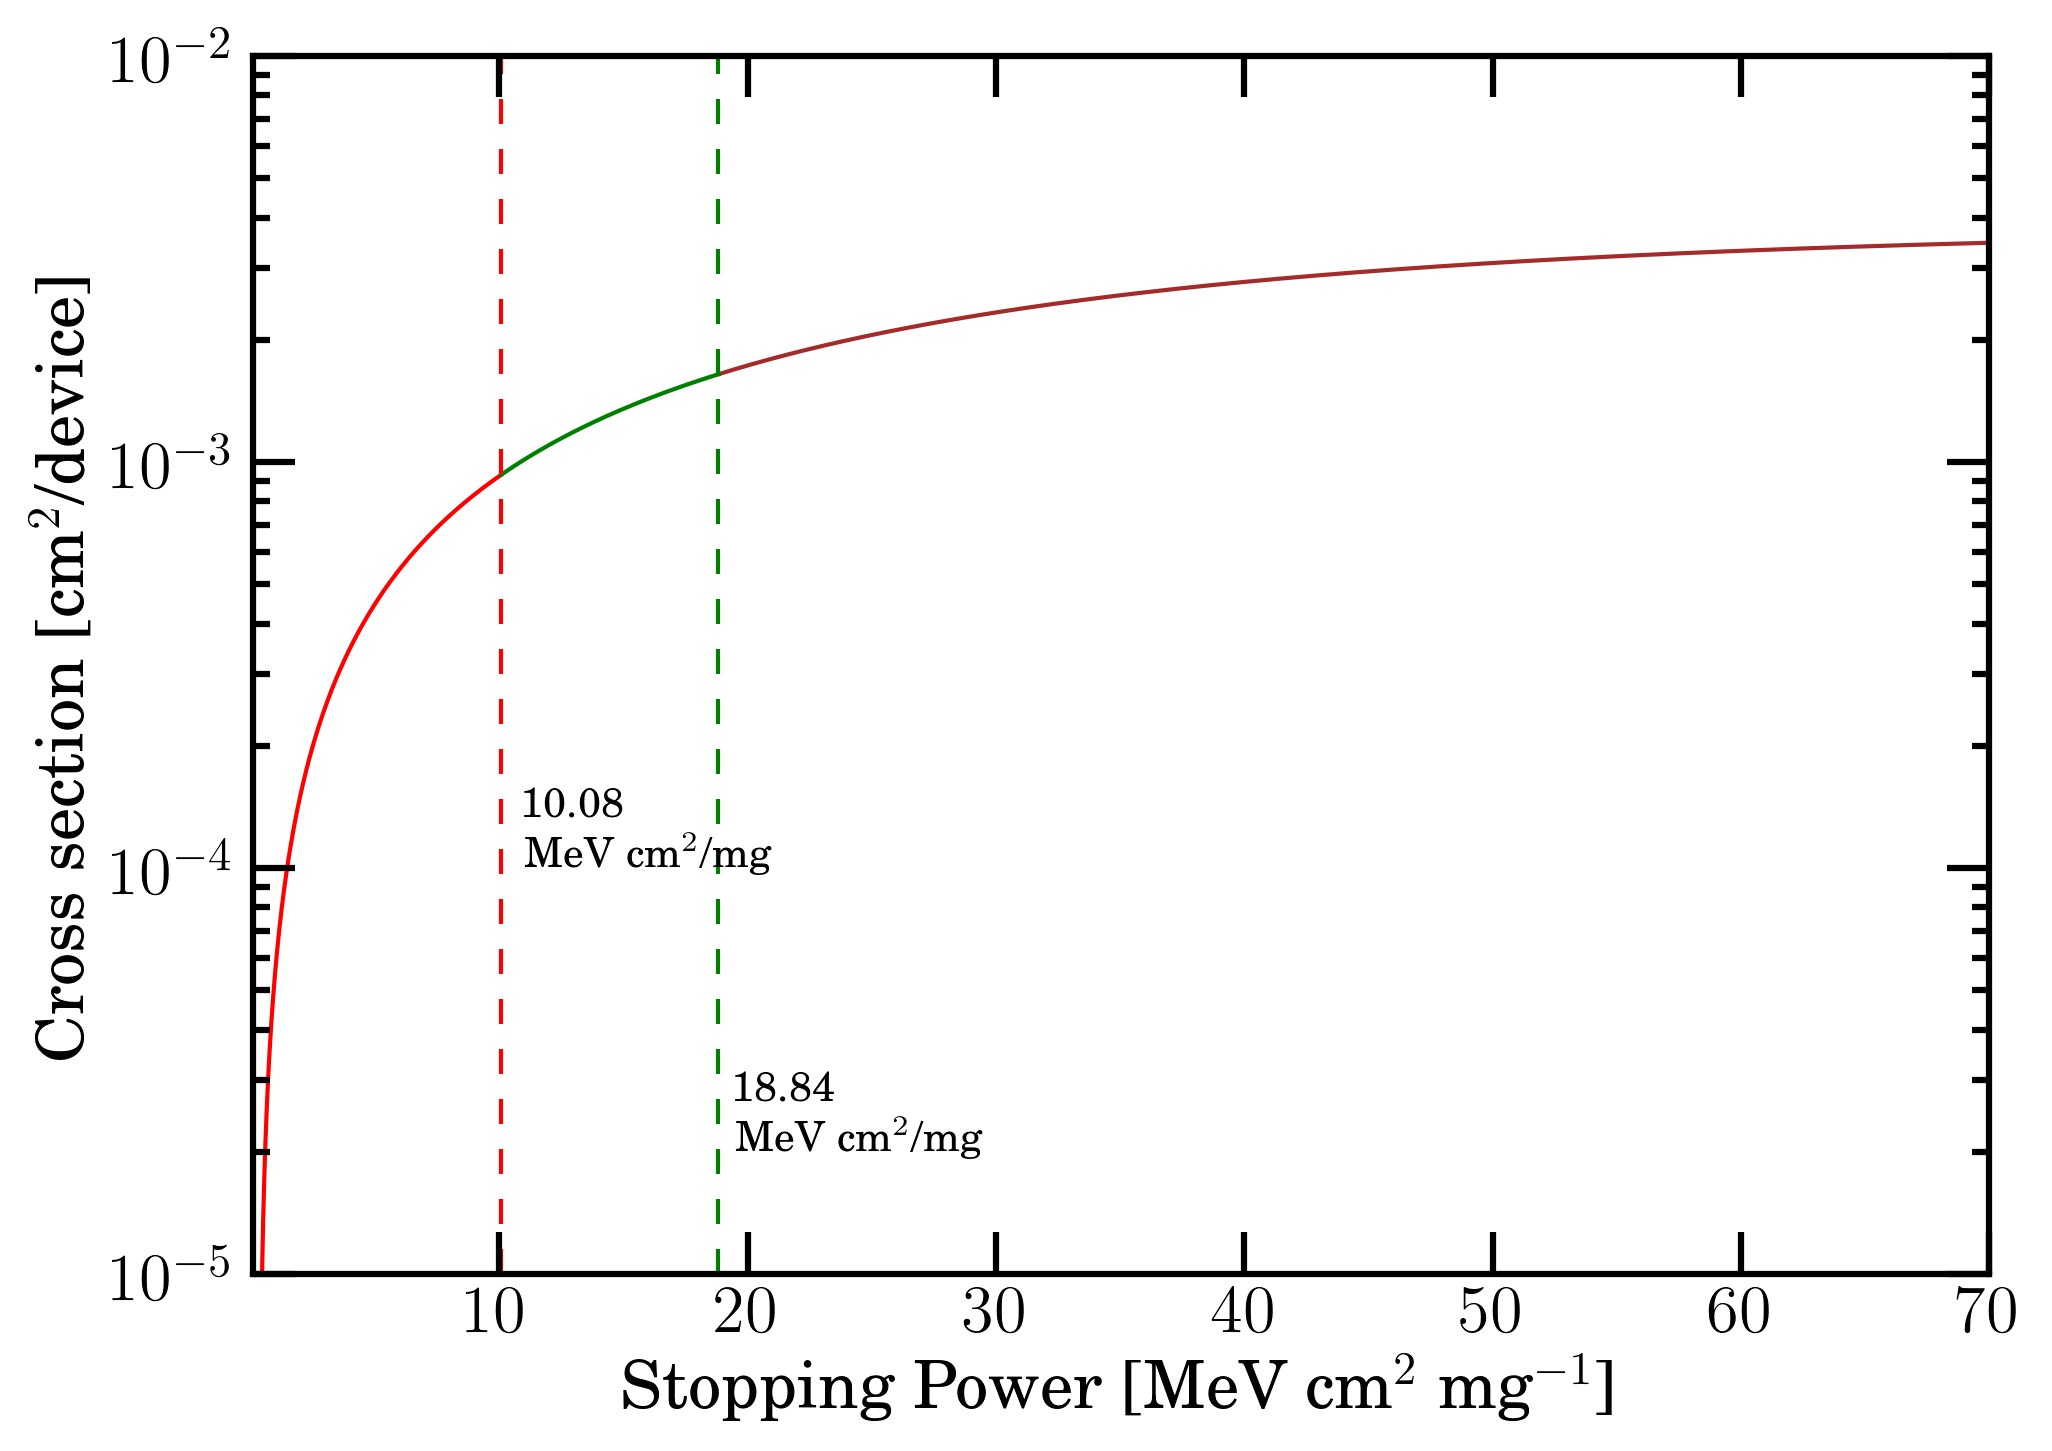 Figure 5. SEE cross section as a function of mass electronic stopping power, using Weibull function parameters at full scale current of 5 mA for the part type DAC5675A from [HIREX (2010)]. The curve is divided in 3 regions: 0.3-10.08 (red curve), 10.08-18.84 (green curve) and above 18.84 (brown curve) MeV cm2 mg -1.
Figure 5 shows the SEE cross section in cm2/device as a function of "LET" (i.e., the linear energy transfer discussed in this webpage) in (MeV cm2)/mg [HIREX (2010)]. To derive the SEE cross section as a function of particle energy - i.e., in the present case, Fe-ion incoming energy -, it is assumed that "LET" quantity employed in [HIREX (2010)] is the mass unrestricted LET, i.e., the mass electronic stopping power (see this webpage). Such a physical quantity can be obtained as function of the energy, for instance, by SRIM 2013 code (SRIM Tutorials) or by SR-framework or - since the measurements were carried out at energies at which the effect of escaped δ-rays can be neglected (e.g., see Figure 11 in this webpage) - by the mass restricted energy loss. In this way, one can fully exploit the knowledge of the Fe-ion spectral fluences discussed previously, which cover energies well beyond the limit of about 10 GeV/amu of SRIM 2013 code.
The mass restricted energy loss functions were computed - following the treatment discussed in this webpage - for W0 = 30, 100, 300 and 500 keV, where W0 is the effective detectable maximum transferred energy. In silicon, for instance, the practical range (from Figure 8 shown in this webpage) is about 6.5, 58.0, 335.6 and 703.9 μm for electrons with kinetic energies of 30, 100, 300 and 500 keV, respectively. Larger path length values are expected due to the scattering of electrons.
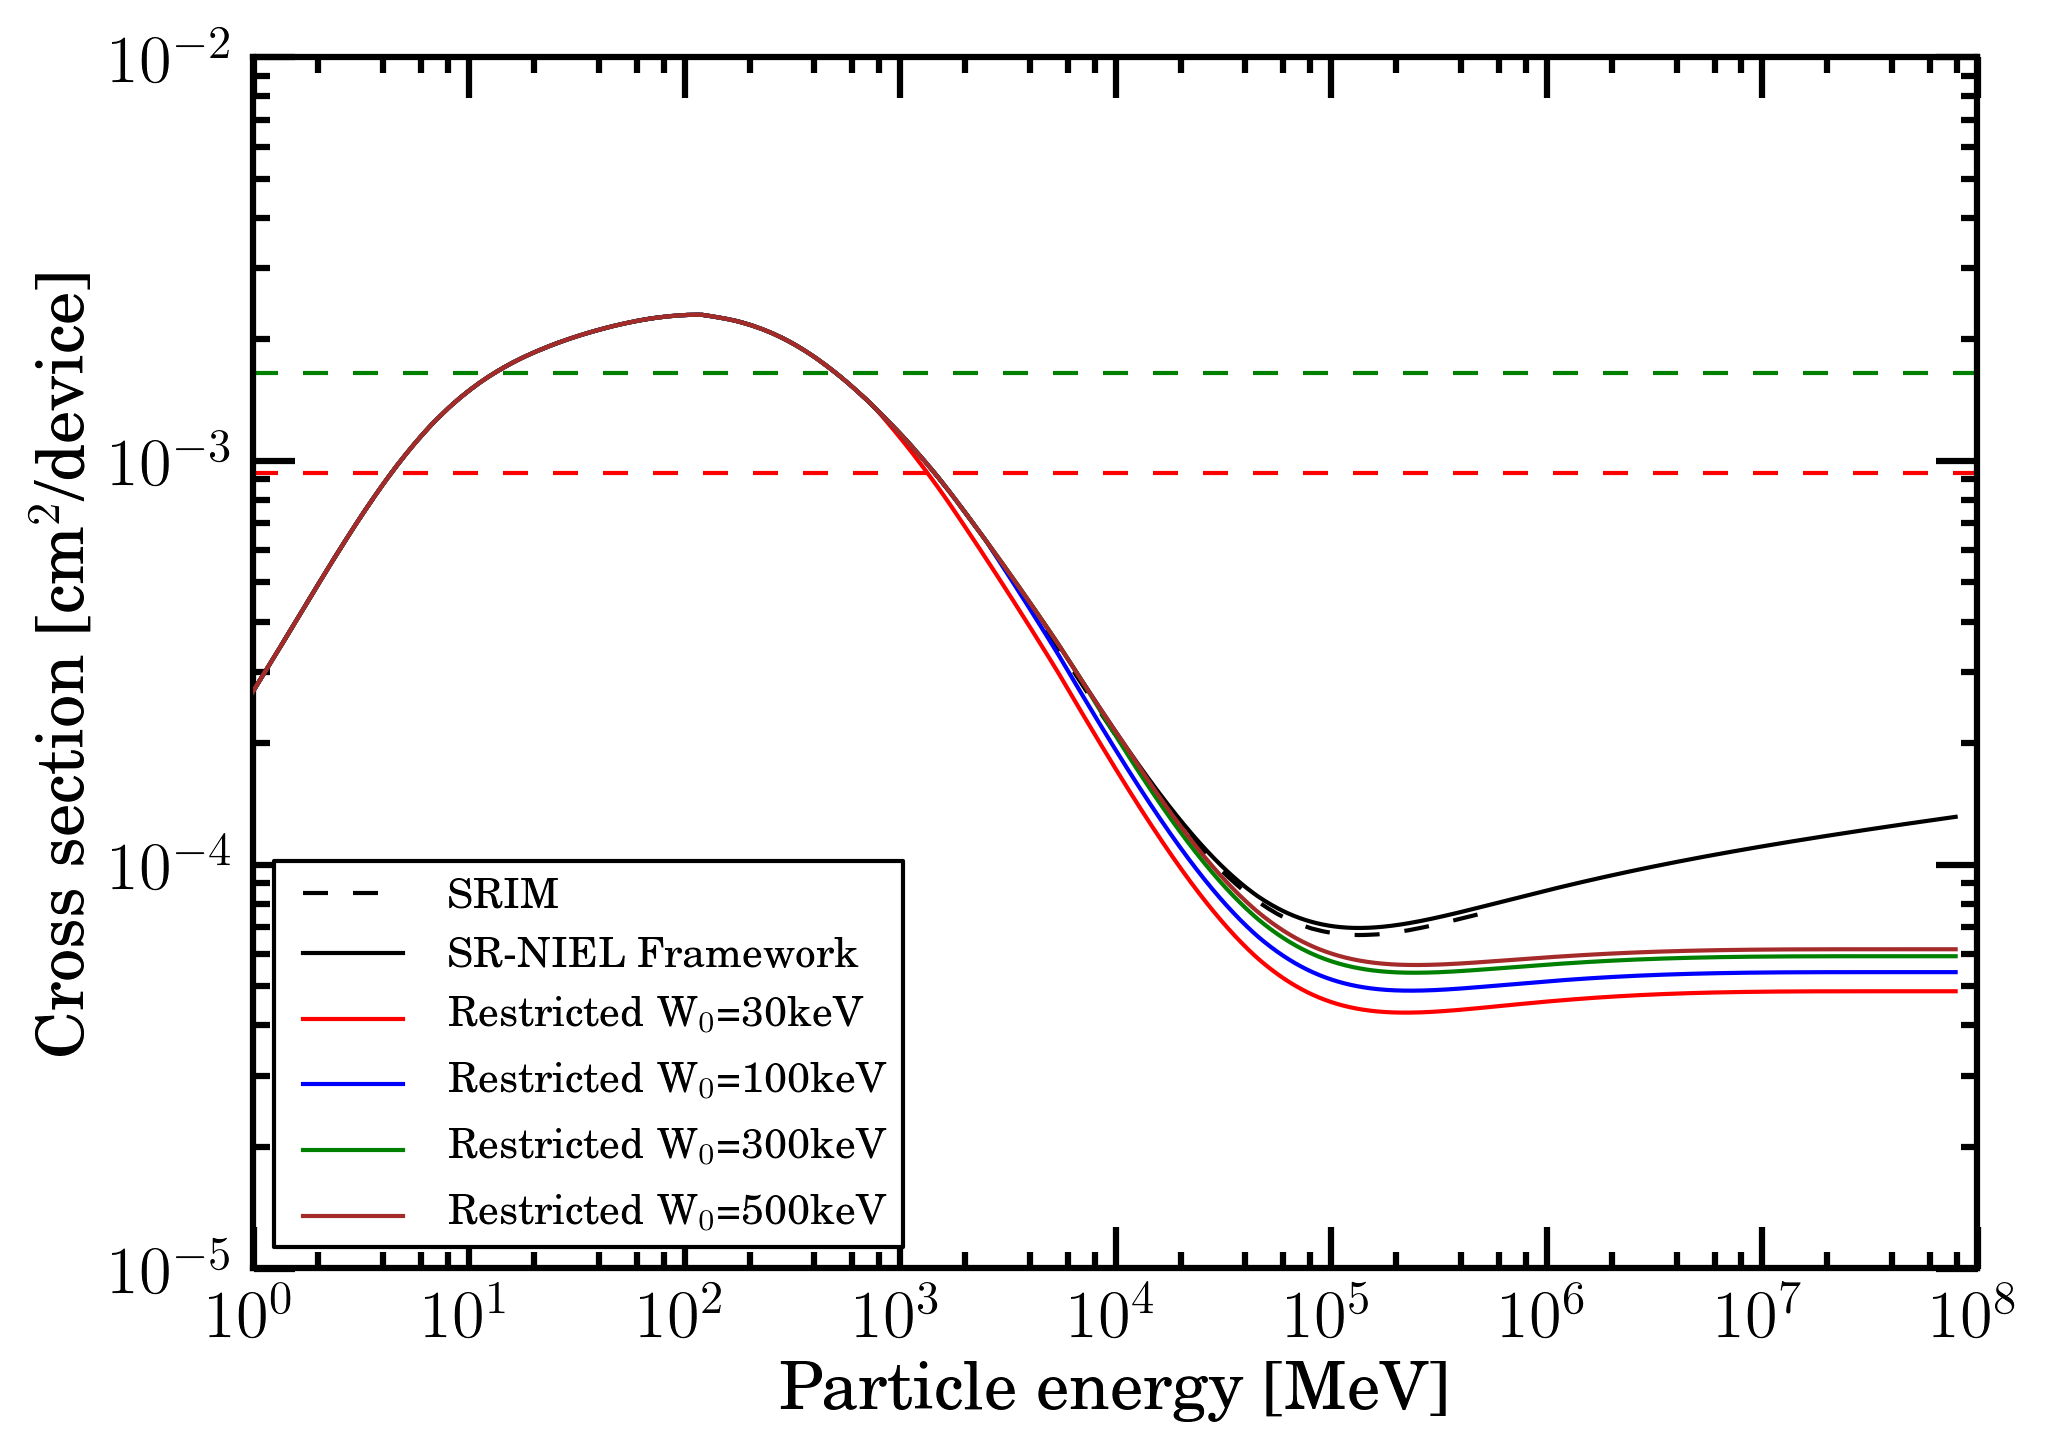 Figure 6. SEE cross section as a function of particle energy (above 1 MeV) obtained from that one using a) the mass electronic stopping power/mass restricted energy loss and b) Weibull function parameters at full scale current of 5 mA for the part type DAC5675A from [HIREX (2010)] and shown in Figure 5. The red (green) dashed line corresponds to the SEE cross section per device at 10.08 (18.84) MeV cm2 mg-1 (see Figure 5).
Expected SEE rates due to the Fe-ion spectral fluence during Carrington rotations 2148 and 2190
The number S of SEEs (e.g., see Tables 2 and 3) during Carrington rotations 2148 and 2190 was computed as:
![]()
where Φ(E) is the spectral fluence (e.g., see Figures 3 and 4) and σi(E) (e.g., see Figure 6) is the cross section with i= SRIM mass electronic stopping power, SR-framework mass electronic stopping power, mass restricted energy loss for W0=30, 100, 300, 500 keV. Furthermore, Eq. (3) was computed for energies above 2.49 GeV for particle in free space and above 1 keV for particle emerging from an an Al absorber with a thickness of 50 mils.
| SRIM mass electronic stopping power | SR-framework mass electronic stopping power | |||
| CR2148 | CR2190 | CR2148 | CR2190 | |
| Free space | 0.150 | 0.276 | 0.162 | 0.292 |
| 50 mils Al | 0.156 | 0.299 | 0.168 | 0.314 |
| 100 mils Al | 0.155 | 0.291 | 0.167 | 0.306 |
Table 2. Number of SEEs obtained from Eq. (3) using SRIM and SR-framework mass electronic stopping powers, for Fe-ions during Carrington rotations 2148 and 2190.
By inspection of Table 2, one can observe that the number of SEEs was slightly increased - with respect to those for free space - after the particle passage through the absorbing media because of the low energetic particle tail created at low energy (e.g., see Figures 3 and 4).
| mass restricted energy loss for W0=500keV |
mass restricted energy loss for W0=300keV |
mass restricted energy loss for W0=100keV |
mass restricted energy loss for W0=30keV |
|||||
| CR2148 | CR2190 | CR2148 | CR2190 | CR2148 | CR2190 | CR2148 | CR2190 | |
| Free space | 0.145 | 0.271 | 0.140 | 0.263 | 0.128 | 0.242 | 0.113 | 0.215 |
| 50 mils Al | 0.151 | 0.293 | 0.146 | 0.286 | 0.134 | 0.265 | 0.120 | 0.238 |
| 100 mils Al | 0.150 | 0.285 | 0.145 | 0.278 | 0.133 | 0.257 | 0.119 | 0.231 |
Table 3. Number of SEEs obtained from Eq. (3) using the mass restricted energy loss for W0=30, 100, 300, 500 keV, for Fe-ions during Carrington rotations 2148 and 2190.
From the above discussions (e.g., from a comparison of results shown in Table 2 and 3 derived in the SR-framework), one has to remark that, without employing the appropriate restricted energy loss, the number of expected SEEs is overestimated, in particular for very thin layers (i.e., those requiring a low W0 value). By contrast, using the electronic stopping power instead of the restricted energy loss with W0 = 30 keV one overestimates the number of SEE per device by about 41 (33) % for CR 2148 (2190). In addition (see Table 2), the energy limit at about 10 GeV/amu in SRIM treatment yields an underestimation of the SEEs with respect to those obtained in SR-framework by about 7 (5) % for CR 2148 (2190), mostly because the particle fluence extends to higher energies. Finally, the final number of SEEs depends on the Carrington rotation that was investigated, i.e., on solar activity: the SEEs found during CR2190 are almost a factor two higher than the corresponding ones in CR2148.
Furthermore, the SEE cross section (Figure 5) was subdivided in three regions with respect to the electronic stopping power of the incoming particle, i.e., 0.3-10.08 (red curve), 10.08-18.84 (green curve) and above 18.84 (brown curve) MeV cm2 mg -1. As an example, in Figure 7, the number of SEEs per device obtained during the Carrington rotation CR2190 are shown as a function of the Fe-ion energy using the Fe residual spectral fluence after traversing 50 mils of aluminum medium and the mass electronic stopping power from SR-framework (i.e., see second row of the last column in Table 2).
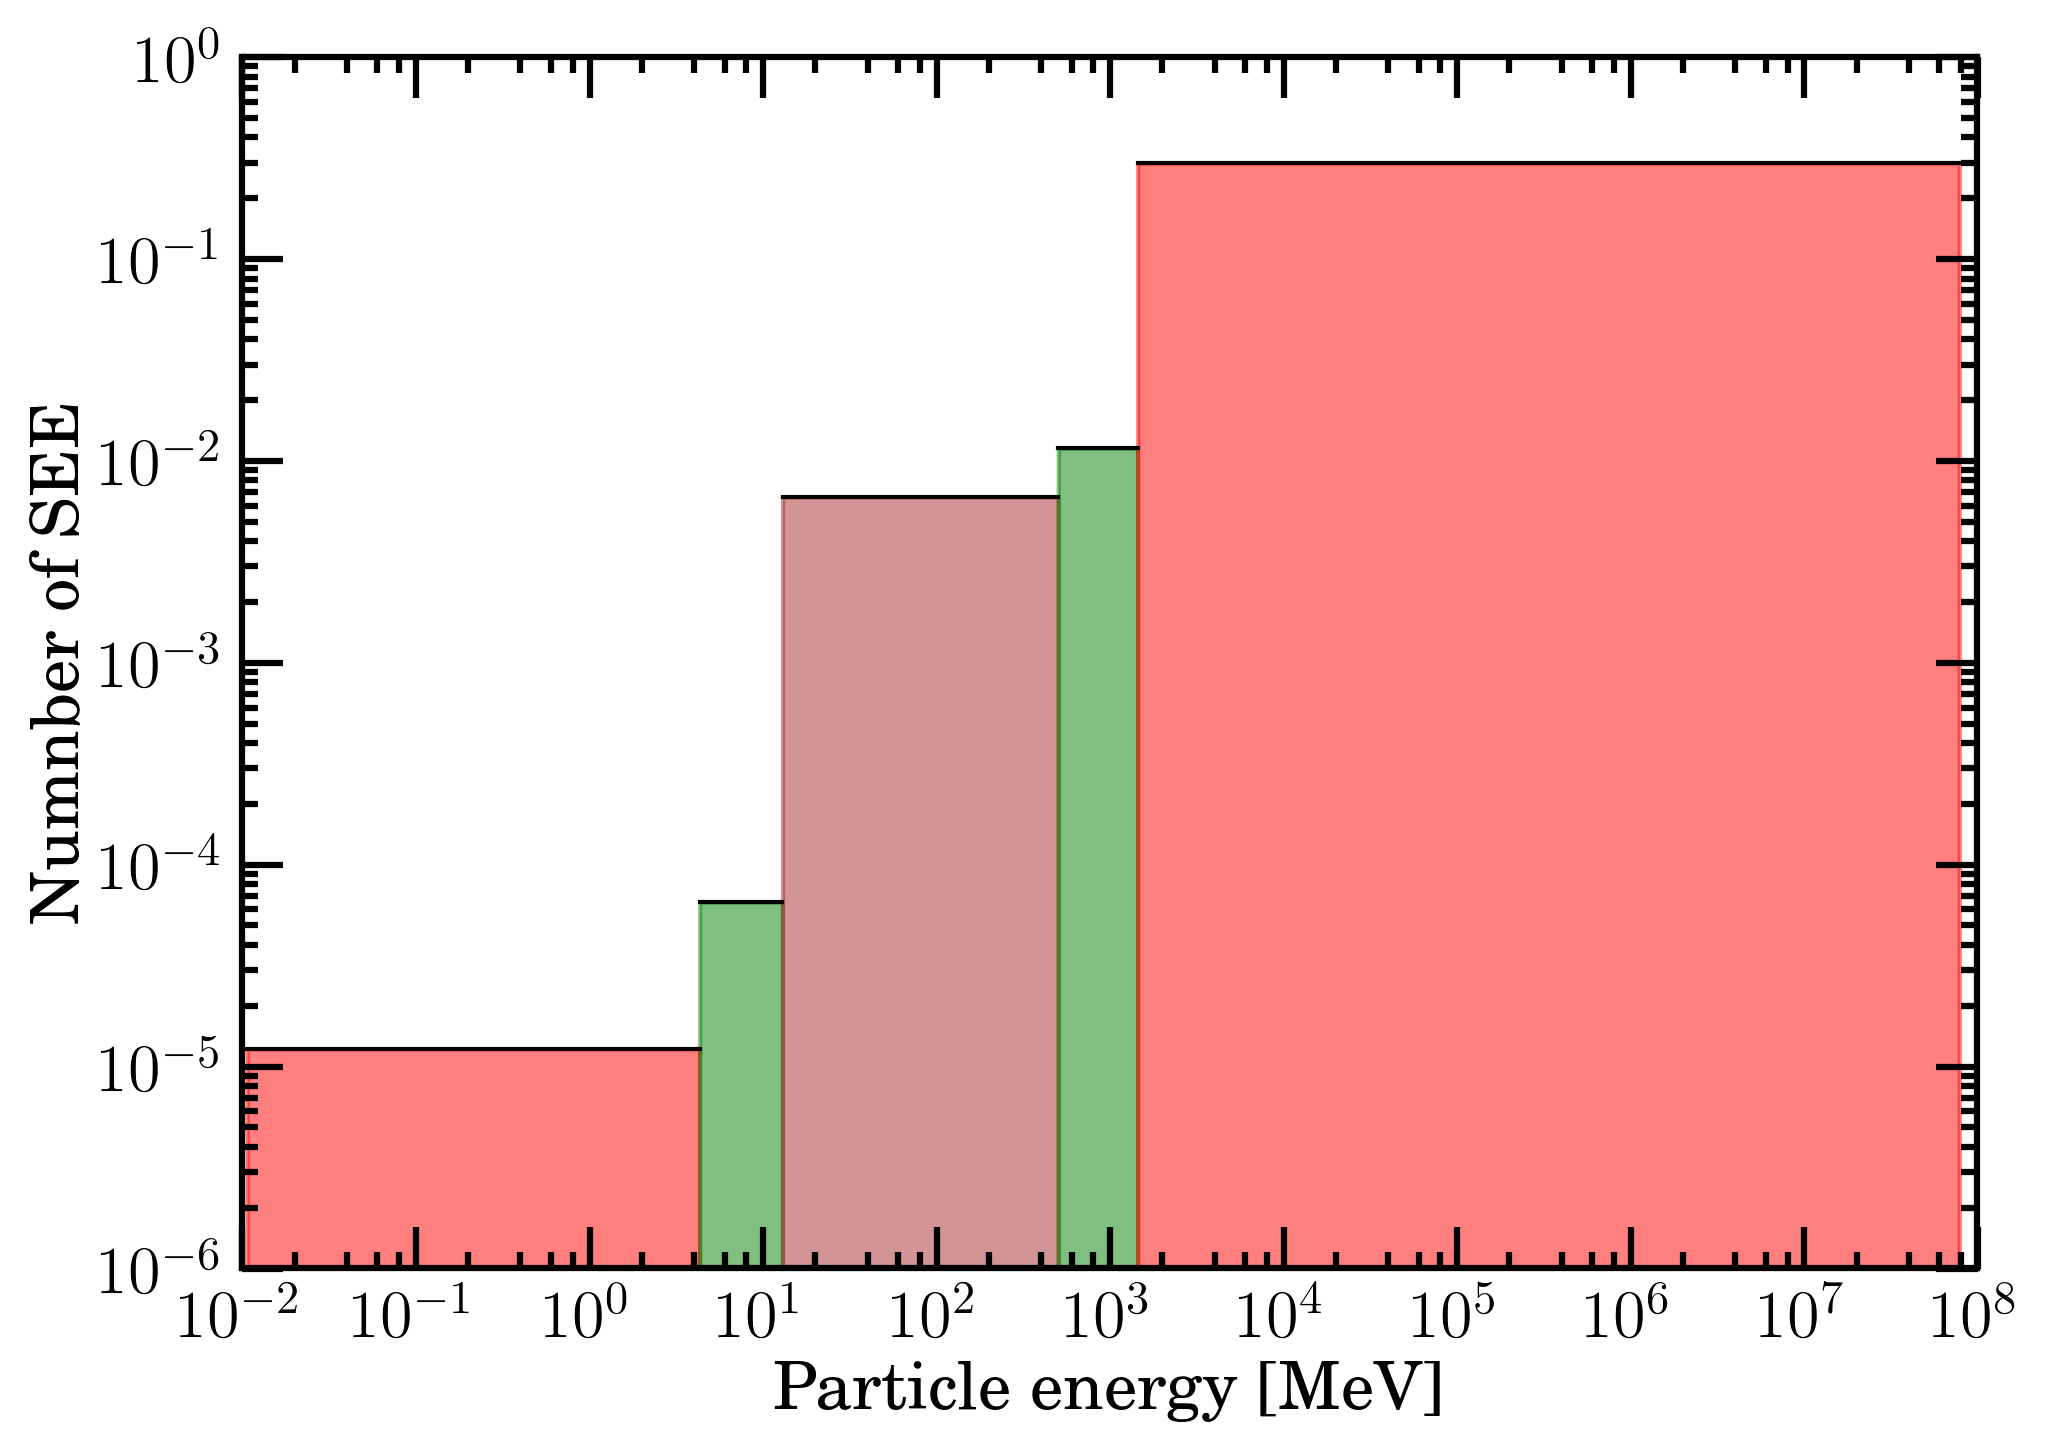 Figure 7. Number of SEE per device - occurring during CR2190 for Fe-ion spectral fluence passing through a 50 mils Al absorber - using the mass electronic stopping power from SR-framework as a function of the energy relative to the stopping power interval 0.3-10.08 (red area), 10.08-18.84 (green area) and above 18.84 (brown area) MeV cm2 mg -1
| from 0.3 up to 10.08 MeV cm2 mg-1 |
from 10.08 up to 18.84 MeV cm2 mg-1 |
above 18.84 MeV cm2 mg-1 |
total |
|||||
| CR2148 | CR2190 | CR2148 | CR2190 | CR2148 | CR2190 | CR2148 | CR2190 | |
| Number of SEE | 0.164 | 0.296 | 0.003 | 0.012 | 0.001 | 0.006 | 0.168 | 0.314 |
| Fraction of total | 97.4% | 94.2% | 1.7% | 3.7% | 0.9% | 2.1% | 100% | 100% |
Table 4. Number of SEEs - occurring during CR2148 and CR2190 for Fe-ion spectral fluence passing through a 50 mils Al absorber - obtained from Eq. (3) and fraction of the total number for different mass electronic stopping power ranges (see Figure 7).
By inspecting Table 4 regarding CR2190, one can remark that more than 94.2% of the SEEs are from the lower electronic stopping power region, i.e., the region in which the expression found for the SEE cross section is less in agreement with experimental data (e.g., see [HIREX (2010)]). Similar result (i.e., about 97.4%) was obtained fo CR2148. Thus, one can envisage that a detailed investigation of SEE cross section and/or of its formal expression in the low electronic stopping power region have to be carried out in order to appropriately estimate the number of SEEs.
Bibliography
[GalProp-HelMod (2016)] GalProp-HelMod (2016). As advertised on the GALPROP website, HelMod website can be used as a a service package to seamlessly calculate the effects of the heliospheric modulation for GALPROP output files. FROM GalProp homepage: "We are pleased to inform the community of the launch of a new service HelMod, which can be used to seamlessly calculate the effects of the heliospheric modulation for GALPROP output file."
[Fano (1963)] Fano, U. (1963). Ann. Rev. of Nucl. Scie. 13, 1.
[HelMod (2019)] HelMod (2019). The Fe-ion differential intensities were obtained from HelMod code [Ver. 4.0.0 - 01.May.2019] on Oct. 8 (2019). The Fe LIS (local interstellar spectrum) is not final and is based on current GalProp code normalization. At present, the Fe-LIS spectrum is under investigation by GalProp-HelMod (2016) join team and, possibly, an absolute scale decreasing of a few percents might be found.
[HIREX (2010)] HIREX (2010). Heavy Ion Test Report on part type DAC5675A - Rad-hard 14-bit 400MSPS D/A converter, Chip manufacturer: Texas Instruments -, report ref. HRX/SEE/0293, 26/7/2010.
[Leroy and Rancoita (2016)] C. Leroy and P.G. Rancoita (2016), Principles of Radiation Interaction in Matter and Detection - 4th Edition -, World Scientific. Singapore, https://www.worldscientific.com/worldscibooks/10.1142/9167#t=aboutBook; ISBN-978-981-4603-18-8 (printed); ISBN.978-981-4603-19-5 (ebook); it is also partially accessible via google books.
E.N. Parker (1965). The passage of energetic charged particles through interplanetary space, Planetary and Space Science 13, Pages 9-49;
https://doi.org/10.1016/0032-0633(65)90131-5
