


The current web calculator for stopping powers of spectral fluence exploits a) the "SRIM Module.exe" (with an upper energy limit of 5 GeV/amu) included in SRIM 2013 code (SRIM Tutorials) - whose maximum available energy is 10 GeV/amu -, i.e., the used electronic stopping power tables are those provided by "SRIM Module.exe" code with a low energy limit of 1 eV; and b) the energy-loss equation (i.e., Eq. (2.18) in Sect. 2.1.1 of [Leroy and Rancoita (2016)]) as discussed here. The overall approach is referred to as SR-treatment framework.
The following link give access to the Web Applications for the SR-treatment framework of Electronic Stopping Power for spectal fluence of protons and ions:
How to use this Electronic Stopping Power Calculator and Ionizing Dose converter for spectral fluence
This tool calculates the spectral mass Electronic Stopping Power for a spectral fluence incident on a material.
The input parameters and options for the tool are described below. When the input form has been completed, pressing the "CALCULATE" button will start the calculation and open the "Results" page (allow for pop-up in your browser settings). The result page will be also linked at the bottom of the calculator page.
The conversion from mass electronic stopping power per unit area to dose is possible under the assumption that the energy lost by the incoming particle is fully absorbed by the medium - for instance, the medium is supposed to to be thick enough to fully absorb the kinetic energy of emitted δ-rays - and the particle energy is almost constant while traversing the absorber.
However, we recall to the user that, as the incoming particle energy increases, high-energy δ-rays generated in the process of collision energy losses can escape from the absorber (e.g., see dedicated webpage). Thus, the energy lost by the incoming particle differs from that deposited in the absorber which approches an approximate constant value (the so-called Fermi plateau). This is illustrated, as an example, in the following figure in which the calculated stopping power and measured deposited energy of massive particles with z=1 in silicon are shown for 1< βγ <1000. βγ = 11.61 is that for a proton with kinetic energy of 10 GeV.
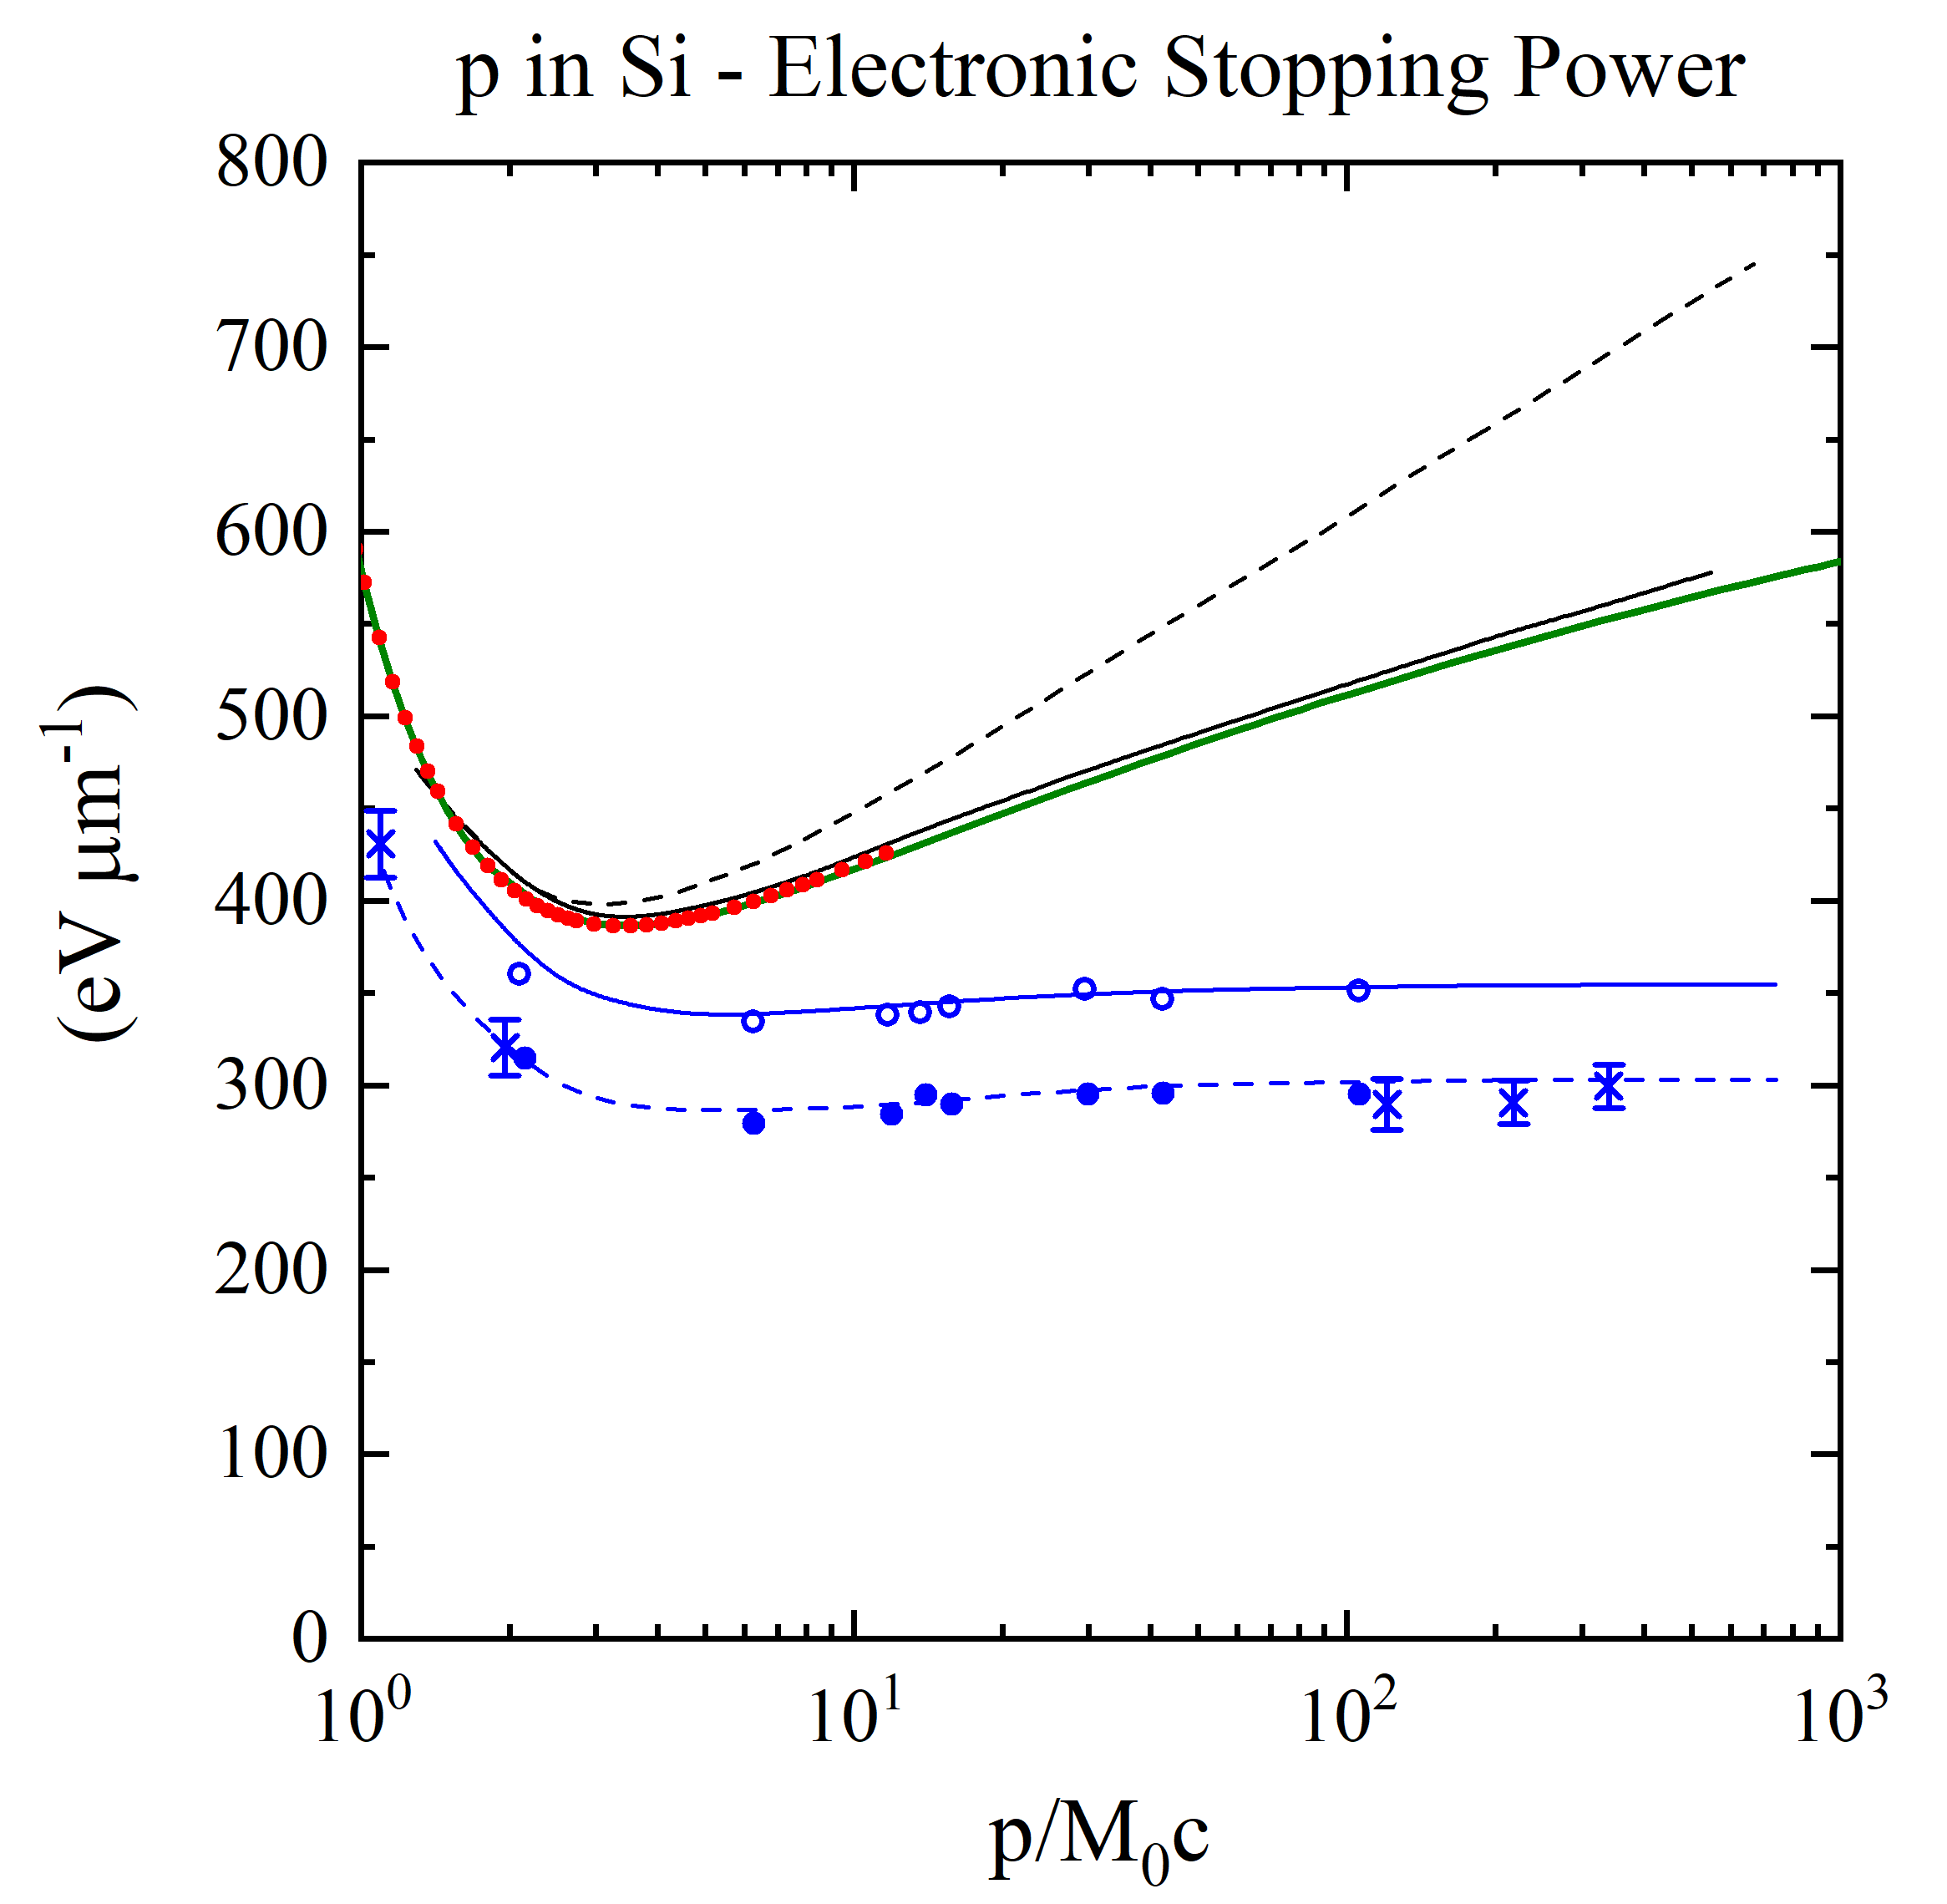 Energy loss in silicon (in units of eV/μm) versus βγ (= p/M0c, where M0 and p are the rest mass and the momentum of the incoming particle with z=1) (see also [Rancoita (1984)]). From the top, the first two curves are: the stopping power without (broken curve) and with (full curve) the density-effect correction (e.g., see Chapter 2 of [Leroy and Rancoita (2016)]) . The red points for incoming protons up to 10 GeV (βγ =11.61) are obtained from the electronic stopping power SRIM calculator currently implemented in this website. The green curve for incoming protons was obtained from the present SR-framework electronic stopping implemented in this website: for proton energies larger than about 16.7 MeV it agrees agrees with SRIM within about 0.5% (see Figure 6 here). For protons with energy of about 510 GeV (βγ around 550), the difference between the electronic stopping power from SR-framework and that from Esbensen calculation (black solid curve) is 1.86%. The following two other curves - compared to experimental data for detector thicknesses of 300 (× from [Hancock, James, Movchet, Rancoita and Van Rossum (1983)]) and 900 μm (◦ and • from [Esbensen et al. (1978)]) - are, respectively, i ) the top one (solid line in blue) for the restricted energy-loss with the density-effect taken into account and ii) the bottom one (dashed line in blue) for prediction of the most probable energy-loss. Furthermore (as discussed at page 82 of [Leroy and Rancoita (2016)]), for βγ > 100, in 300 μm thick silicon detector the observed most probable energy-loss (in eV/μm) is about 5% lower than that in 900 μm thick silicon detetor in agreement, within the experimental errors, with the decrease of about 6.5% calculated by means of Eq. (2.56) at page 81 of [Leroy and Rancoita (2016)].
Input Parameters:
- Incident particle (for Protons&Ions Calculator)
- Target material
- Spectral fluence.
Incident Particle
In the Protons&Ions Calculator, using the pull down menu, the user can select the species of the incident particle, either a proton or one of the elemental ions.
Except for proton and alpha particle masses, the user can also modify the mass (in amu) of the incident particle (e.g., for all isotopes one can refer to this page): the default mass is that of the most abundant isotope (MAI). Further information are available at the following webpage.
Target Material
In the section "Target Selection" it is possible to specify an User Defined target material or a predefined Compound material. User can also select the target as gas, this is allowed only for single element and natural gas target (H, He, N, O, F, Ne, Cl, Ar, Kr, Xe, Rn).
The stopping power in target gases is usually higher than that in an equivalent solid target. The Gas/ Solid correction disappears for higher velocity ions with energies above 2 MeV/amu. But at lower velocities the effect can be quite large - almost a 2 times change in stopping bacause of the Phase effect near the Bohr velocity, 25 keV/amu.
in the User Defined section individual elements can be selected as well as the composition of the target material choosing the number of elements in the compound. The required parameters for each element are:
- Atomic number (Z)/Chemical symbol
- Stoichiometric index or element fraction
Electronic Stopping Power for User Defined Compounds
Electronic Stopping Power for User Defined Compounds can be determined by means of Bragg's additivity rule, i.e., the overall Electronic Stopping Power in units of MeV cm2/g (i.e., the mass electronic stopping power) is obtained as a weighted sum in which each material contributes proportionally to the fraction of its atomic weight. For instance, in case of a GaAs medium ones obtains (e.g., Eq. (2.20) at page 15 in [ICRUM (1993)]):
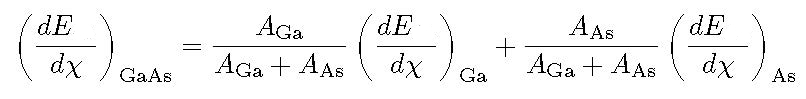
where ![]() and AGa [AAs] are the Electronic Stopping Power (in units of MeV cm2/g) and the atomic weight of Gallium [Arsenic], respectively.
and AGa [AAs] are the Electronic Stopping Power (in units of MeV cm2/g) and the atomic weight of Gallium [Arsenic], respectively.
As discussed in SRIM. (see help of "The Stopping and Range in Compounds" in SRIM-2013), the Compound Correction is usually zero for compounds containing heavy atoms, Al(Z>=13) or greater. All experiments with compounds such as Al2O3, SiO2, Fe2O3, Fe3O4, SiC, Si3N4, ZnO, and many more, show less than 2% deviation from Bragg's additivity rule which estimates the stopping by the sum of the stopping in the elemental constituents. That is, the stopping in Al2O3 is the same as the sum of the stopping in 2 Al + 3 O target atoms. For these compounds there is no need for a Compound Correction. This correction should be accounted for in compounds containing mostly H, C, N, O and F for ion stopping below 2 MeV per atomic mass unit and is negligible above 5 MeV per atomic mass unit. In the current calculator, no correction is applied for target atoms lighter than Al. Further details are available at SRIM Compound, and SRIM Compound Theory.
Predefined compounds
In the Compoud section it is possible to select a predefined compound including the SRIM compound corrections in the stopping power calculation.
For instance, in the following plot, it is shown the percentage difference of the stopping power of H2O (selected as User Defined material) and Water_Liquid (selected as a Compound) as a function of the incoming proton energy in MeV: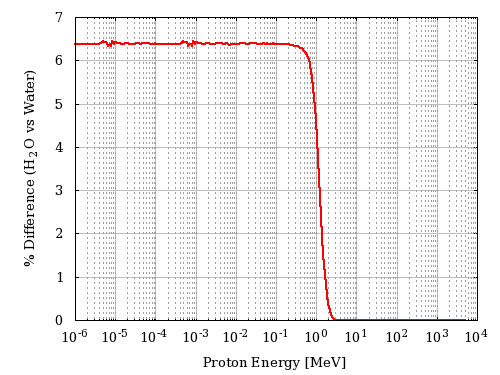
Spectral Fluence
This section define the points of the spectral fluence as a function of energy.
The input format is one point per line (Energy - Flux , separated by a space or tab); it is also possible to copy and paste values. The minimum value of the particle spectral fluence is 1 eV, the maximum is 5 GeV/nucleon.
Result
The result page contains the input spectral fluence and the Electronic Stopping Power curve in MeV cm2/g (i.e., the mass stopping power), calculated at the same energies defined in the spectral fluence. For every energy points the mass electronic stopping power per unit area and energy is calculated and displayed in the second graph. The mass electronic stopping power per unit area and energy is integrated at the energy steps defined in the spectral fluence and the results of every single bin is given in the last column of the table (mass electronic stopping power per unit area).
Extension for high energy particles
As discussed in this webpage the mass electronic stopping power is derived at sufficiently high energies by mean of energy-loss equation (i.e., Eq. (2.18) in Sect. 2.1.1 of [Leroy and Rancoita (2016)]) while, at low energies, SRIM treatment has to be employed.
- Electronic stopping power for single elements.
For every ions passing through any elemental medium up top uranium - with the exception of Z = 85 and Z = 87 for which no data are avalable to account the density effect -, the transition energy at which the SRIM treatment is replaced by that employing Eq. (2.18) (from Sect. 2.1.1 of [Leroy and Rancoita (2016)]) is such that i) protons and ions (from He up to U) are considered almost fully-ionized and the term accounting for the non-participation of inner electrons of the medium (with atomic number Z) in the collision loss process is negligible (as discussed in this web page), ii) difference among the mass electronic stopping powers (derived foloowing the two approaches) typically does not exceed 5%.
In Figure 3, It is shown the percentage difference among the two approaches at the upper limit of the chosen transition energy range, for every incident ion in each elemental target. The overall average difference for every ions in every target is 2% (± 1.4%). The worst case (5.41 ±0.38%) occours for incident ions with z = 91, the best case (0.34 ±0.33%) for for incident ions with z = 34.
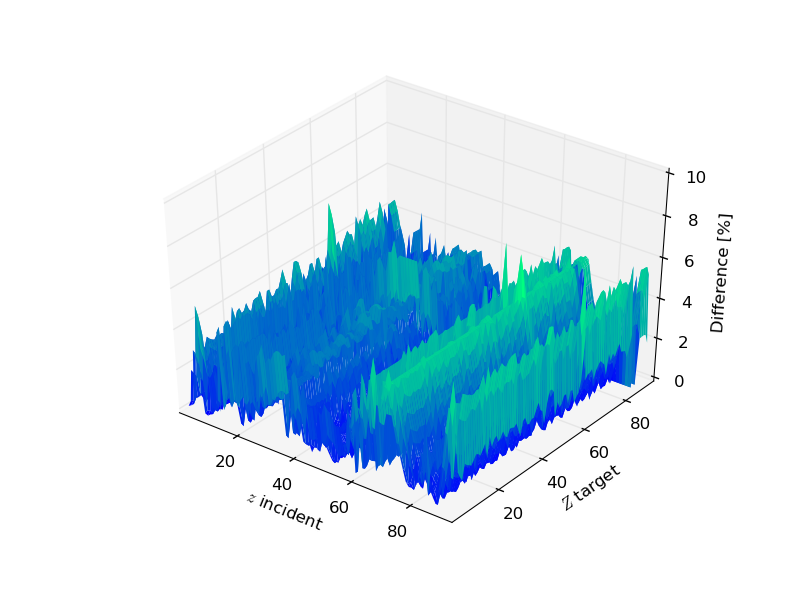 Figure 3. Percentage difference between SRIM and energy-loss equation at the upper limit of the transition energy range, for every incident ion in each elemental target . The mass of the incoming particle corresponds to that of the most aboundant isotope.
In Figures 4 (protons in silicon medium) and 5 (iron-ions in silcon medium) , the so finally mass electronic stopping powers within sr-niel frameworth are shown together with the corresponding SRIM curve.
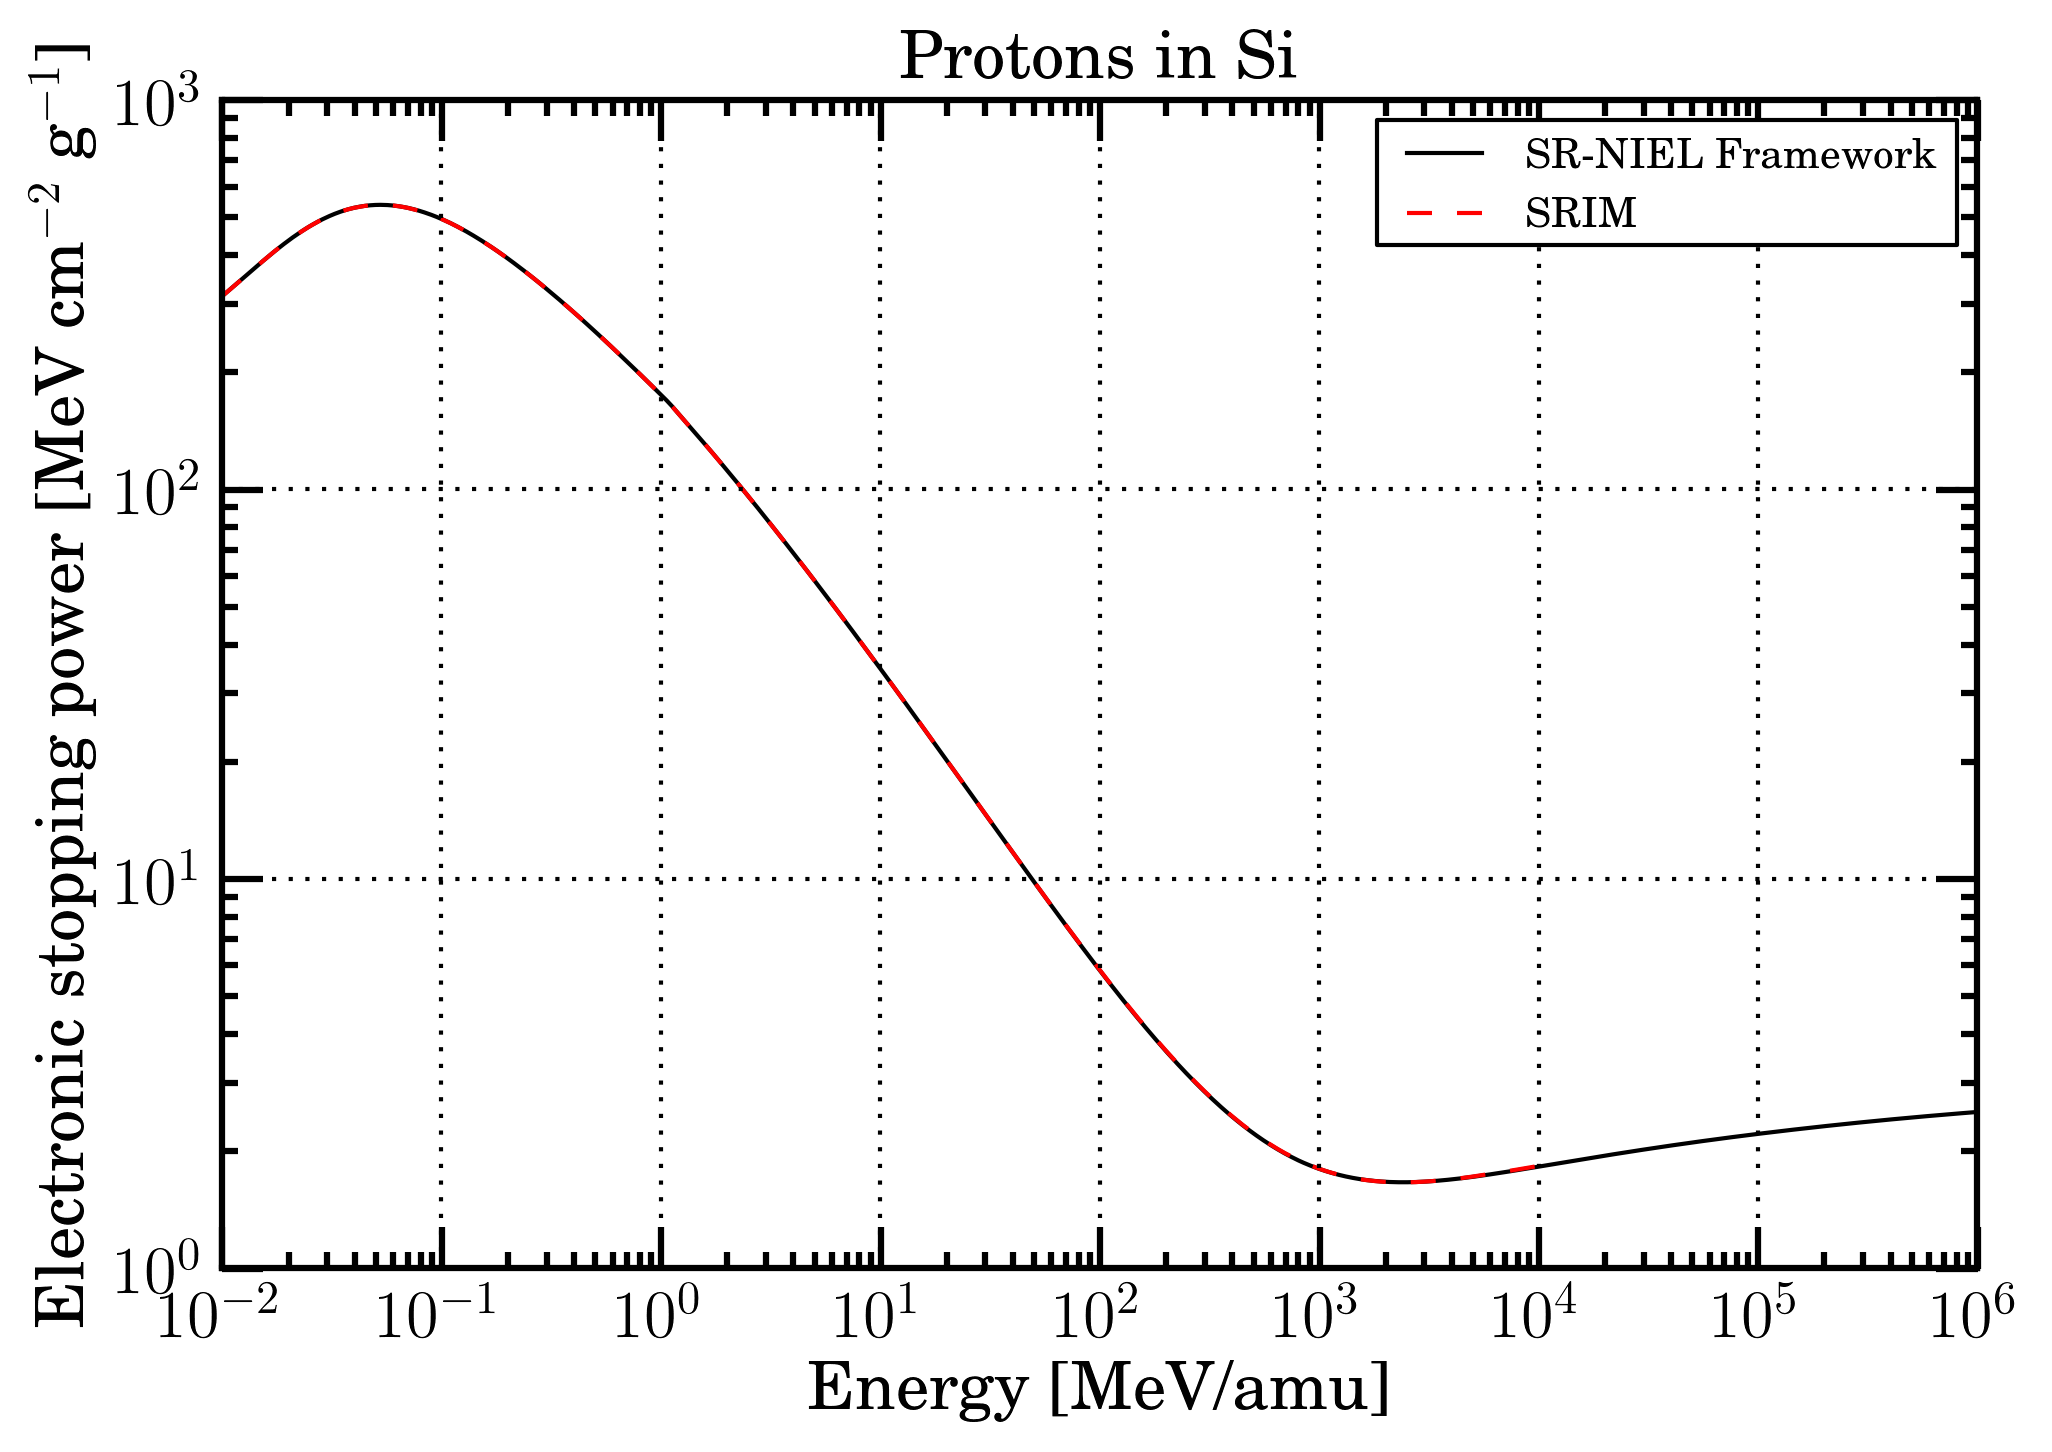 Figure 4. Mass electronic stopping power as a function of energy for protons in Silicon. Black solid curve is SR-NIEL treatment, red dashed curve is SRIM calculation.
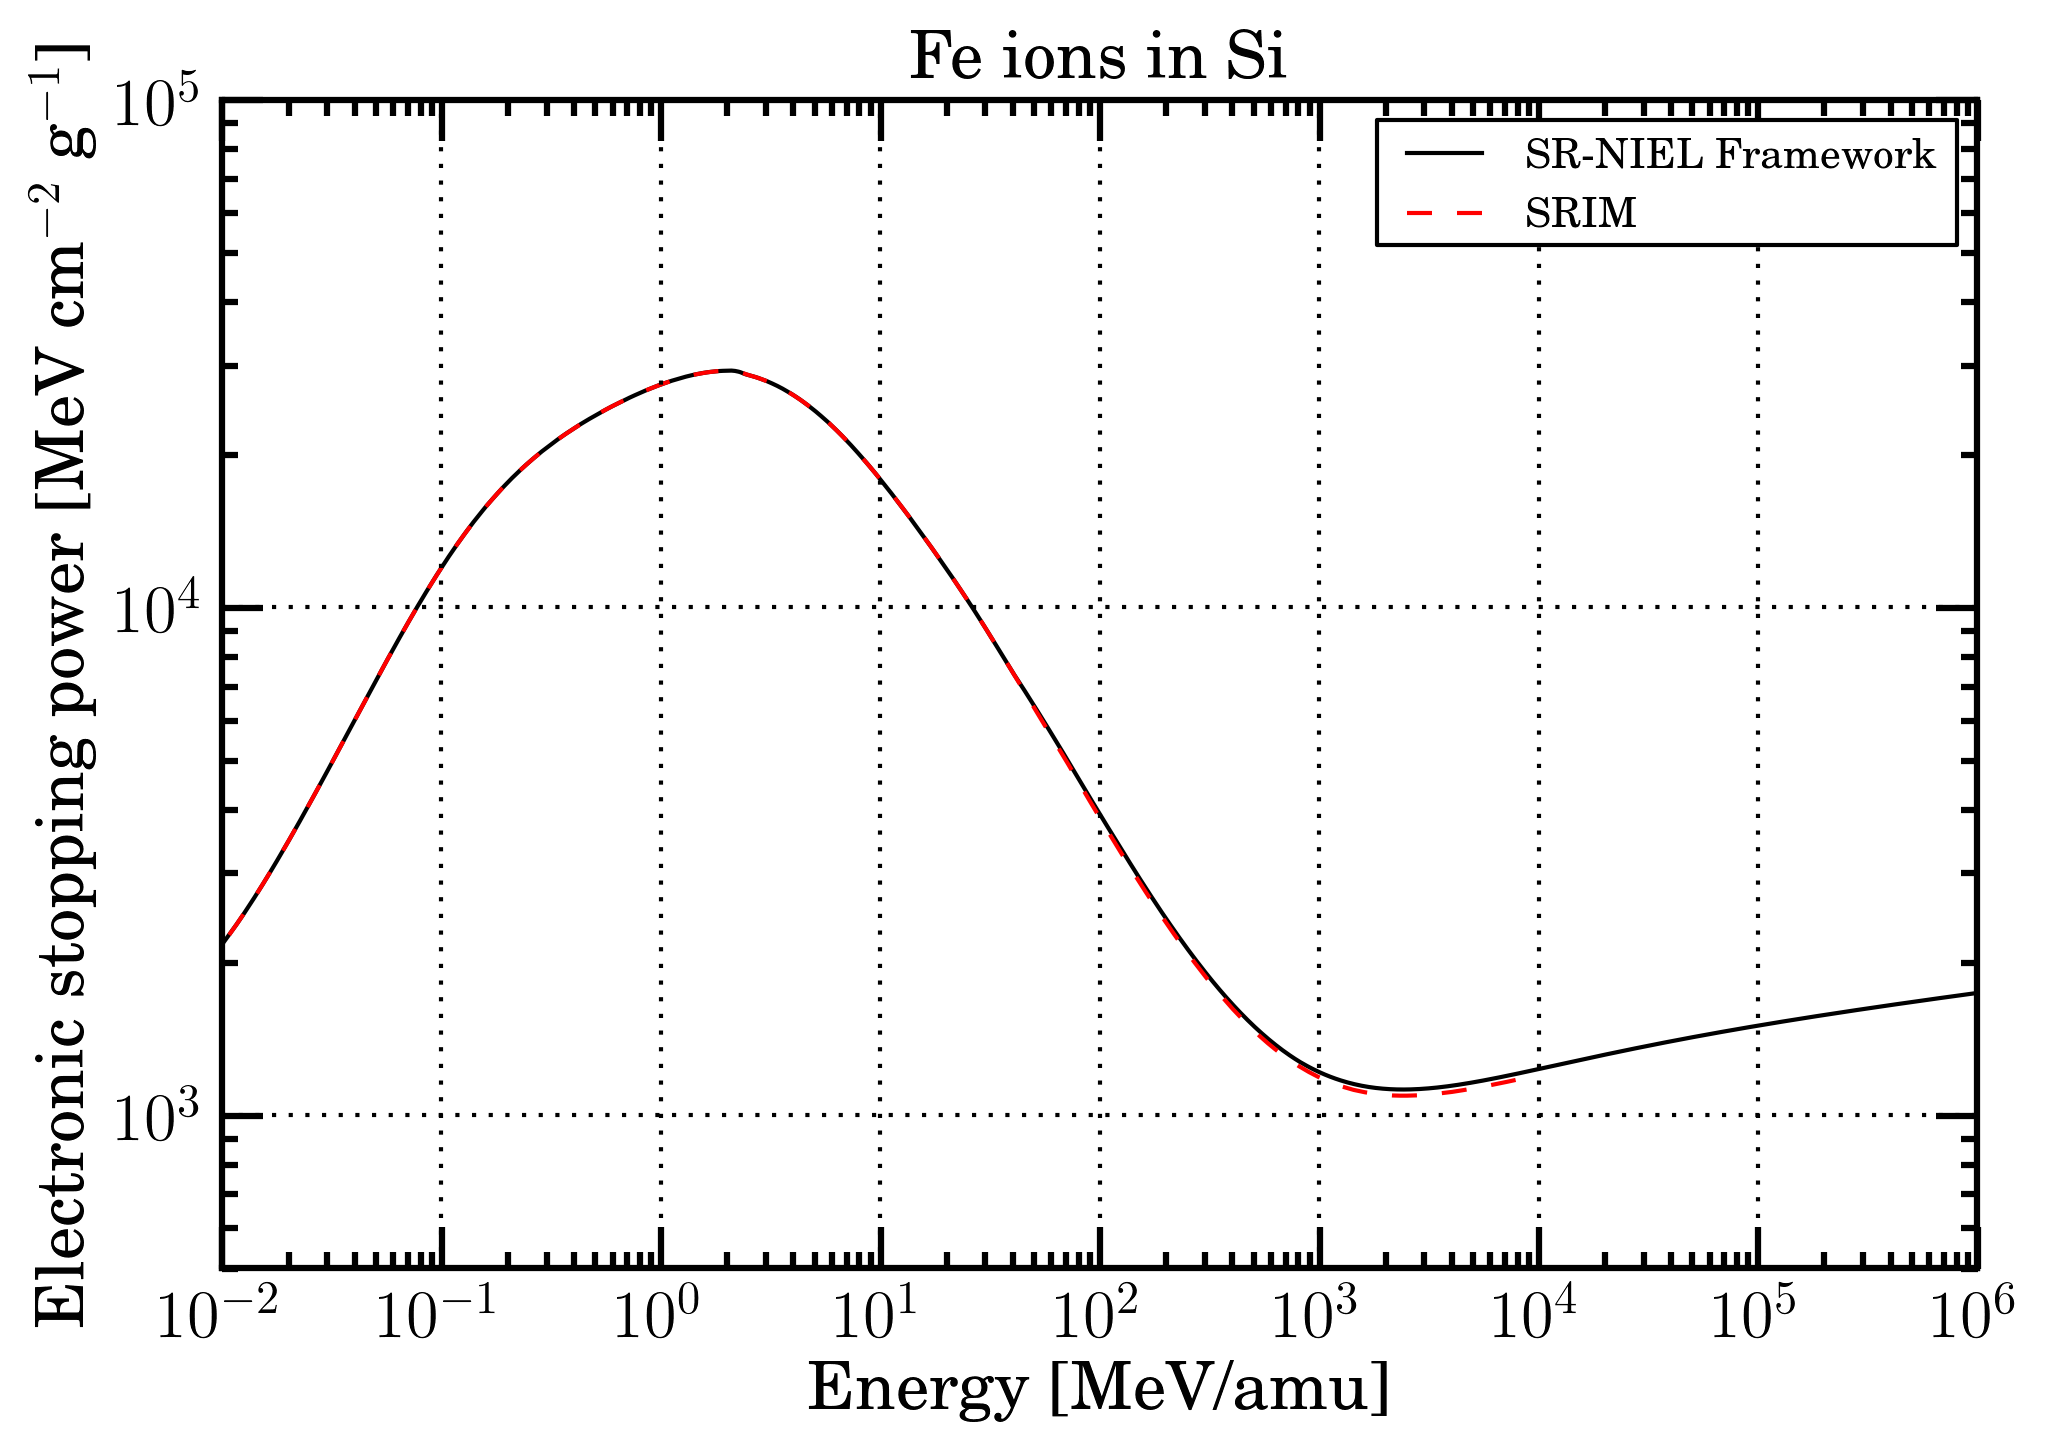 Figure 5. Mass electronic stopping power as a function of energy for Fe ions in Silicon. Black solid curve is SR-NIEL treatment, red dashed curve is SRIM calculation.
- Electronic stopping power for compounds
For every ions passing through a compound reported here, the electronic stopping power is derived means of the SRIM treatment at low energies and bty that from SR-framework at high energies, similarly to what already discussed for elemental media. For few compounds belonging to the ICRU list the parameters employed for the energy loss formula (including those for the densiity effect) are reported in Table II of Sternheimer et al. (1984).
In Figure 6, It is shown the percentage difference among the two approaches at the upper limit of the chosen transition energy range, for every incident ion in each of compound media (see compound list webpage). The overall average difference for every ions in every target is 2.25% (± 1.24%). The worst case (4.81 ±0.91%) occours for incident ions with = 91, the best case (0.65 ±0.95%) for incident ions with = 1. In about 0.3% of all possible combinations among incident particles and compound media, such a percentage difference exceeds the value of 7%. In those cases, only the electronic stopping power from SRIM is availble.
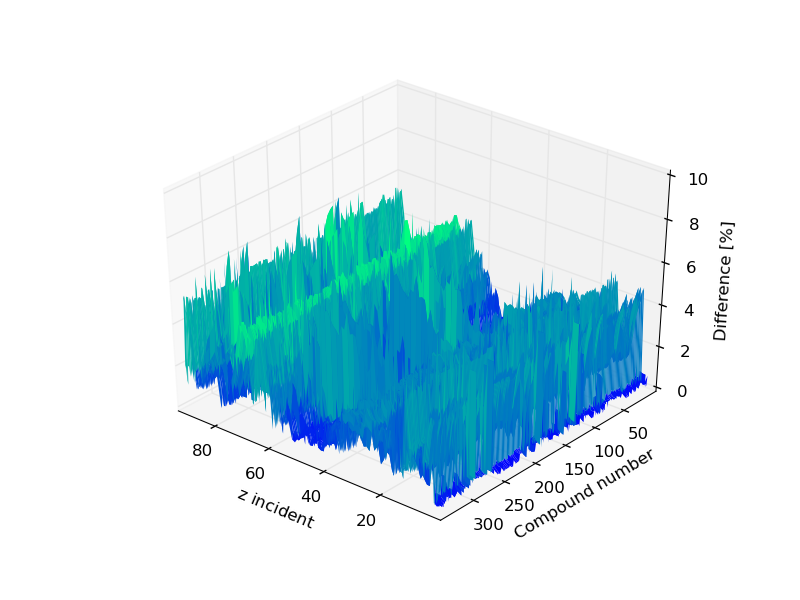 Figure 6. Percentage difference between SRIM and energy-loss equation at the upper limit of the transition energy range, for every incident ion in each of compound media: the compound number is provived in the compound list webpage. The mass of the incoming particle corresponds to the one of the most aboundant isotope
In Figures 7 (protons in propane medium) and 8 (iron-ions in propane medium) , the so finally mass electronic stopping powers within sr-niel frameworth are shown together with the corresponding SRIM curve.
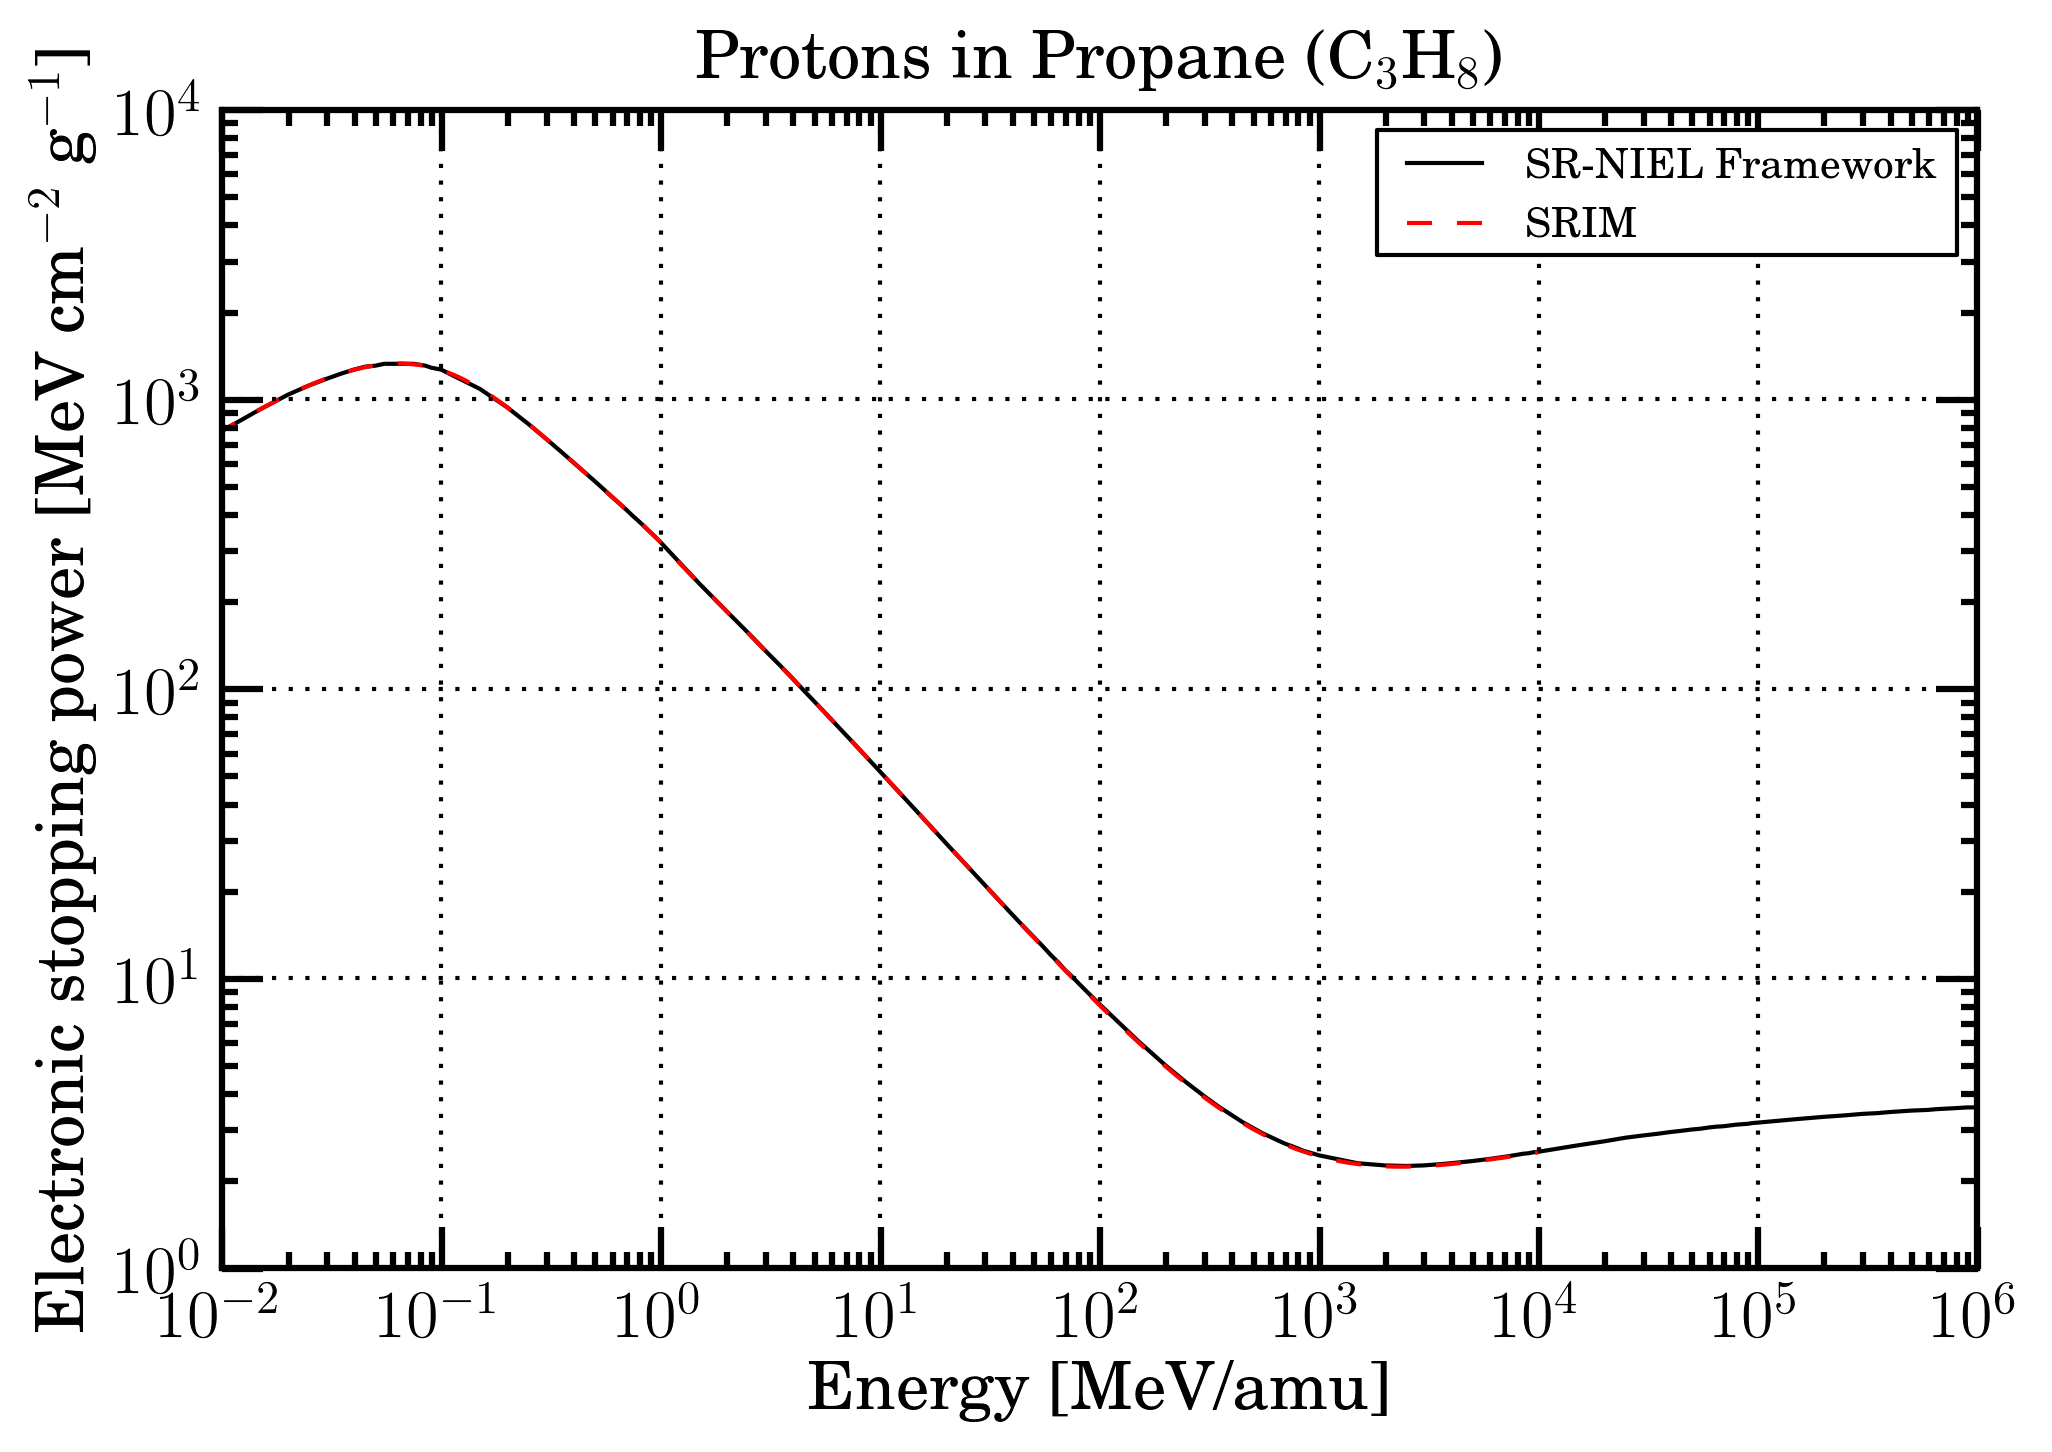 Figure 7. Mass electronic stopping power as a function of energy for protons in Propane. Black solid curve is SR-NIEL treatment, red dashed curve is SRIM calculation.
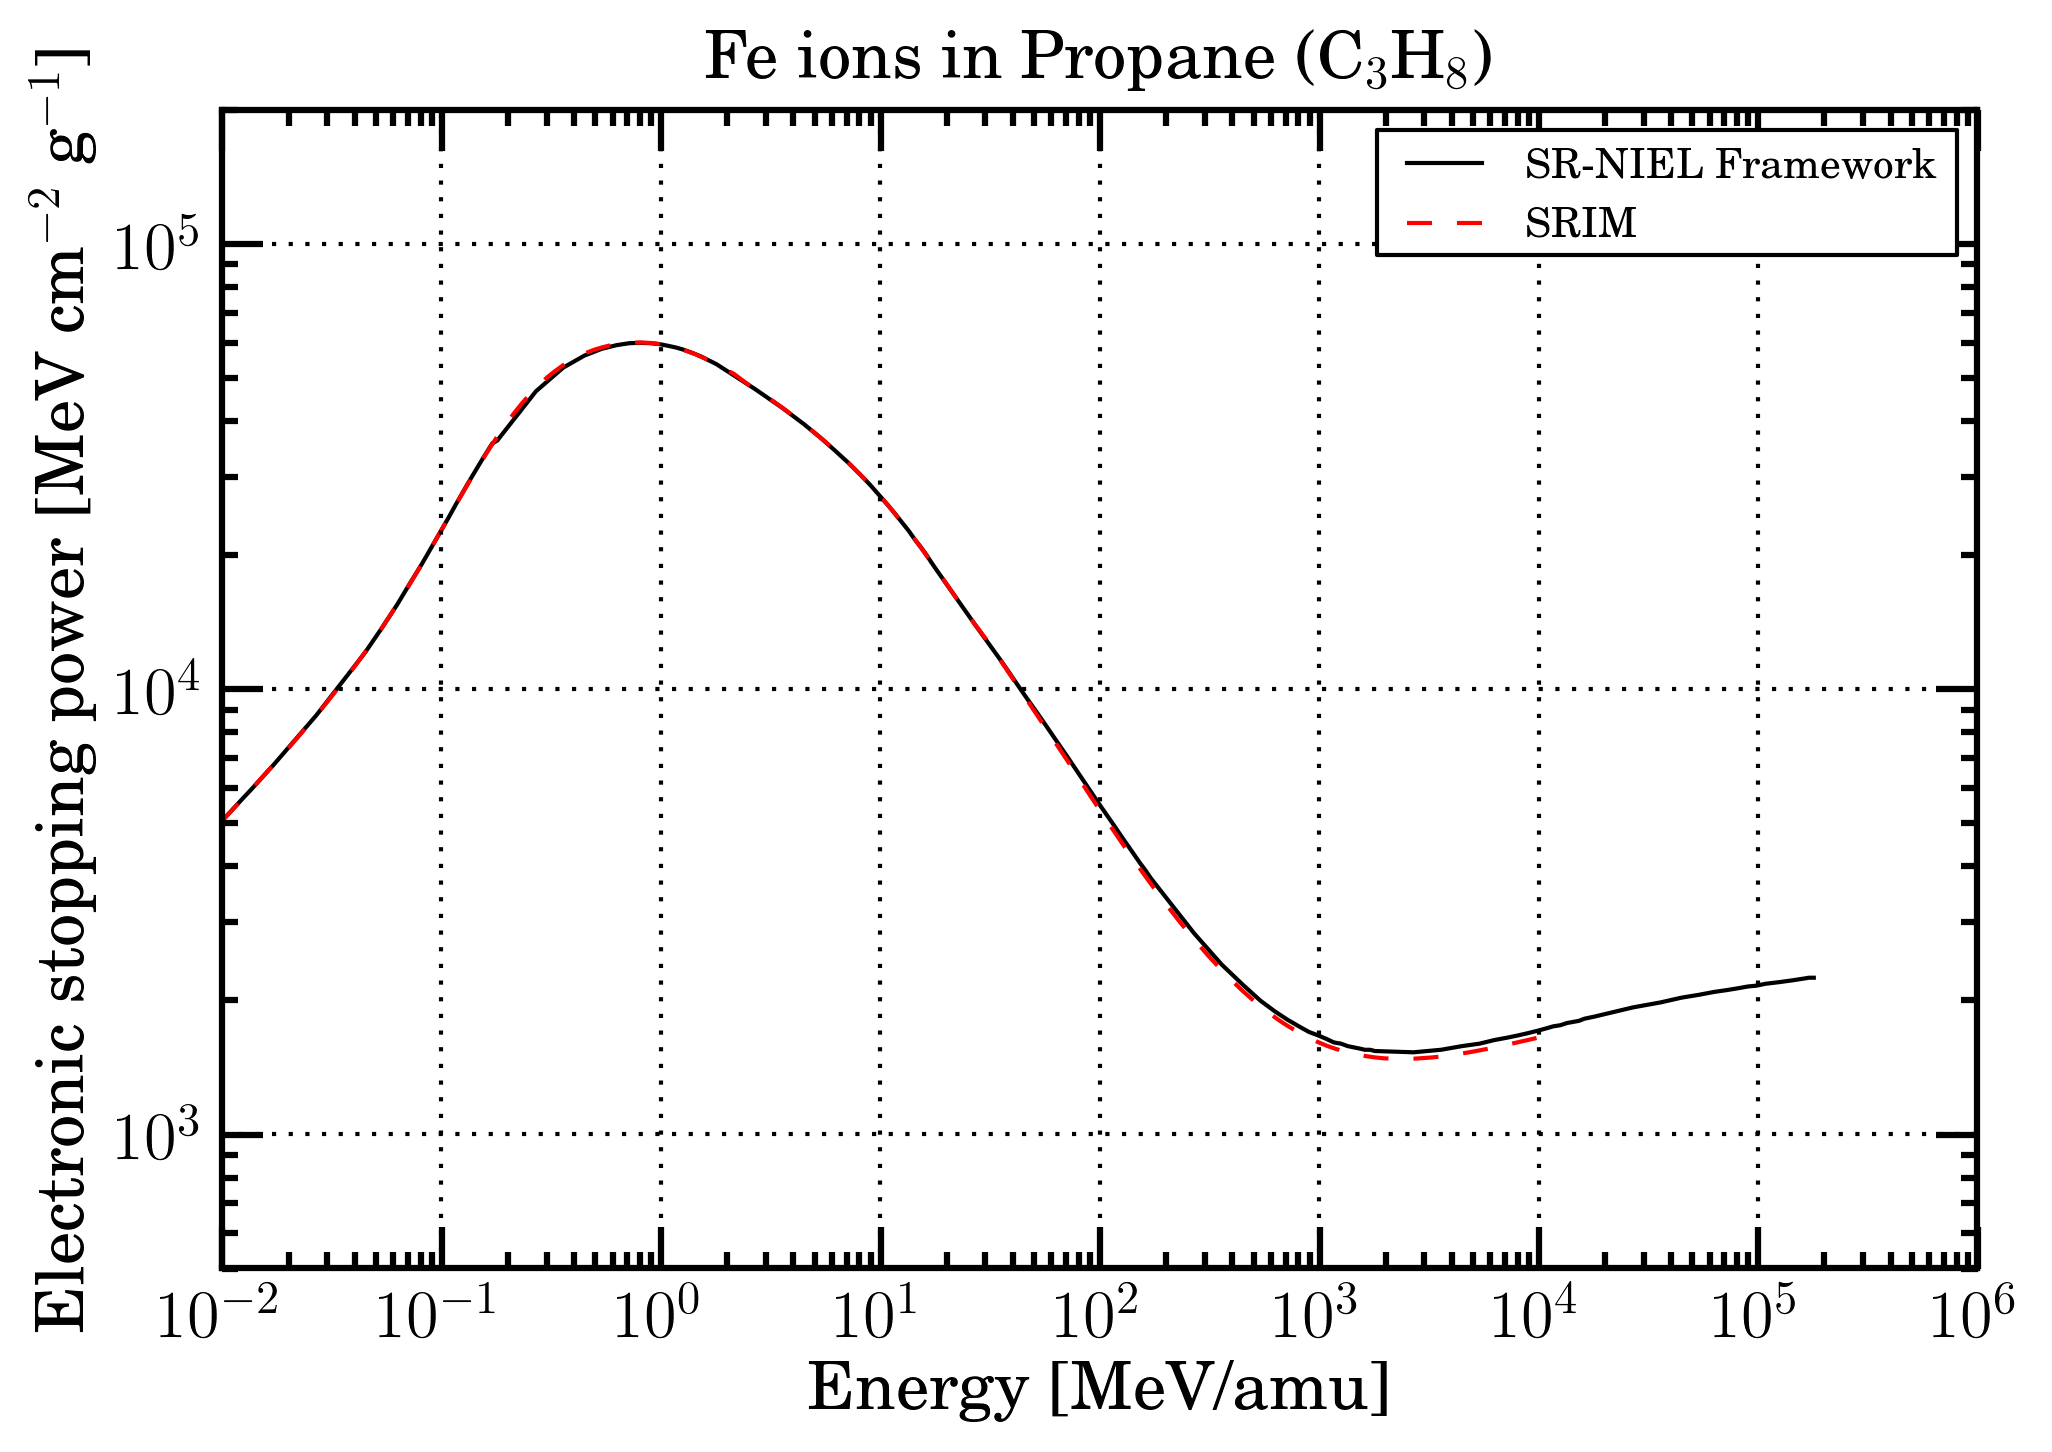 Figure 8. Mass electronic stopping power as a function of energy for Fe ions in Propane. Black solid curve is SR-NIEL treatment, red dashed curve is SRIM calculation.